Development Kit Simplifies Air Quality Sensor System Design
資料提供者:DigiKey 北美編輯群
2017-05-24
Air quality sensing is vital for health and safety, and even mandatory in certain areas such as classrooms and other education facilities. For developers, however, air sensor system design can be problematic. Air quality sensors often seem temperamental during setup and subject to drift with use.
A comprehensive air quality evaluation kit from Amphenol Advanced Sensors addresses these challenges, freeing developers to focus on air quality applications rather than low-level sensing functions.
The effects of poor air quality
Poor air quality exerts a wide impact on health and safety. Carbon dioxide (CO2) and dust concentration are among the principal determinants of air quality and are known to produce striking effects.
CO2 blood levels largely control respiration rate. Elevated CO2 levels brings increases in respiration rate, heart rate, blood pressure, and vasodilation. Some of the early indicators of unhealthy CO2 levels include sweating and headaches brought on by vasodilation of peripheral and cerebral vessels, respectively. The impact of increased CO2 levels on the central nervous system can be insidious, presenting symptoms including lassitude, drowsiness, and eventually convulsions.
Even well below levels that produce its more pronounced effects, CO2 levels found in typical indoor environments lead to lower work performance and increased absence. Not surprisingly, many school districts mandate use of CO2 monitoring in school building ventilation systems.
While increased CO2 levels broadly impact physiological systems, dust and other particulate matter (PM) increase morbidity and mortality rates due to its effects on the respiratory system. PM10 particles (2.5 to 10 micrometer (μm)) and PM2.5 (less than 2.5 μm) particles are small enough to reach deep into the respiratory system. Even after only a few hours of exposure to elevated concentrations of these particles, individuals can exhibit pronounced respiratory and cardiovascular symptoms that require hospital admission. More prolonged exposure increases mortality from cardiovascular and respiratory diseases, as well as from lung cancer in long-term cases. Worse, the World Health Organization finds that there is no “…safe level of exposure or a threshold below which no adverse health effects occur.”1
Sensor challenges
Given the dramatic effects of high CO2 and PM levels, opportunities continue to grow for embedding air quality sensors in air conditioners, air purifiers, and other products. However, developing these systems can be challenging. Even developers experienced with other types of sensors find that air quality sensors can be idiosyncratic due to their special demands for placement, shielding, and calibration.
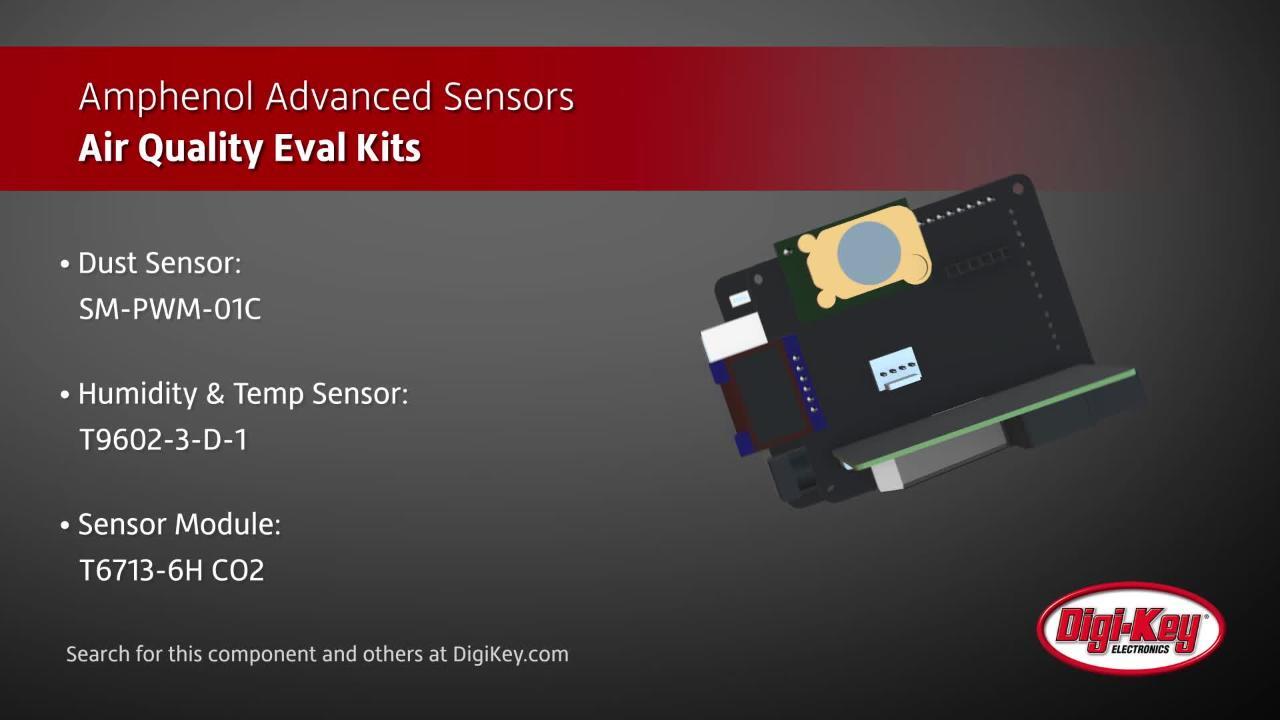
Designed to address these challenges, the Amphenol air quality evaluation kit, AAS-AQS-UNO-RH-CO2, provides a complete hardware and software platform for rapid development of these systems. Built around an Arduino-compatible board, the kit provides a small display and multiple Telaire/Amphenol sensors including the company’s SM-PWM-01C dust sensor, T6713 CO2 sensor, and T9602 humidity and temperature sensor. The sensors and display connect to the main board through a sensor shield (Figure 1).

Figure 1: The Amphenol air quality evaluation kit includes an Arduino-compatible board, connected through a sensor shield to a dust sensor (right side of board), display, CO2 sensor (left), and humidity/temperature sensor (wrapped cable); a USB interface provides a simple cable connection (lower left) to a host system. (Image source: Amphenol)
On the software side, Amphenol’s air quality software package builds on Arduino software libraries to offer the foundation for high-level air quality applications.
Developers can evaluate air quality sensor designs using all or just a few of the sensors provided with the kit. Engineers developing an air quality sensor system for an air conditioner, air purifier, or smoke detector are likely to limit their focus to PM detection. For evaluating dust sensor designs, Amphenol also provides the AAS-AQS-UNO, a version of the kit that includes the same Arduino-compatible board, sensor shield, and display, but only the SM-PWM-01C dust sensor.
PM detection
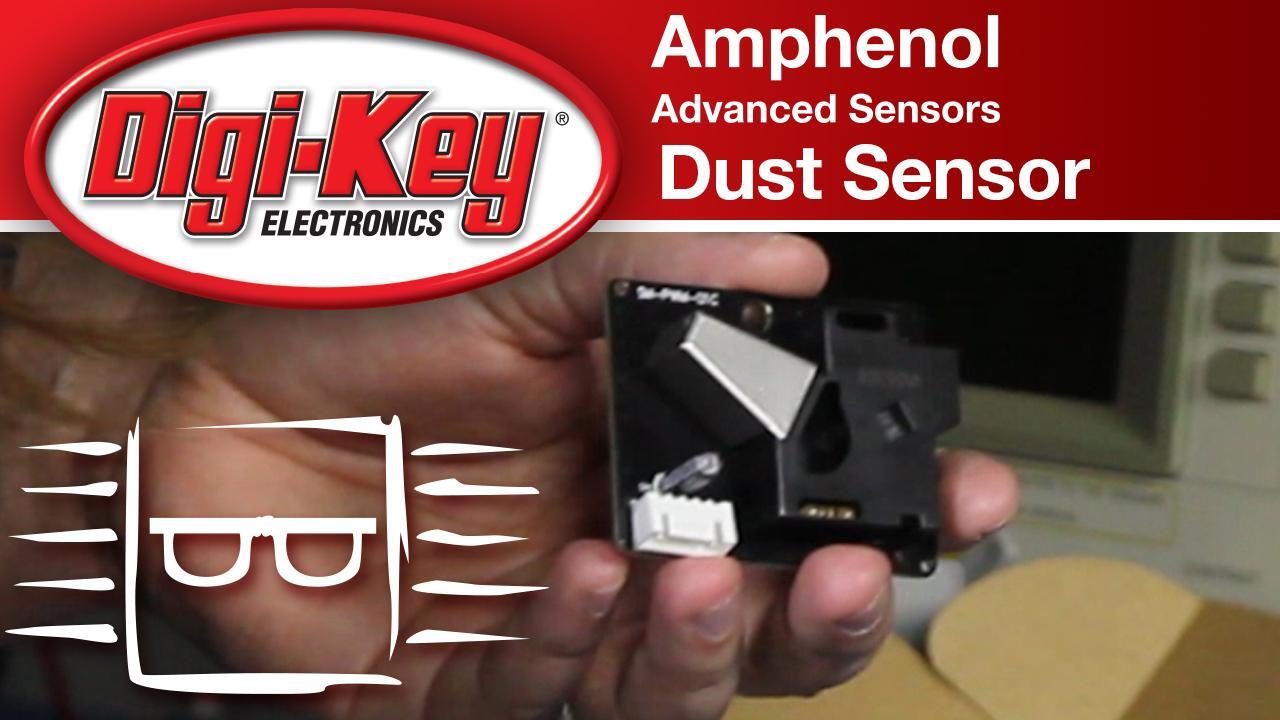
Whether used alone or in combination with the other sensors, the SM-PWM-01C dust sensor is designed to provide a drop-in solution for PM detection. The device integrates all the components required to detect small particles, including a voltage regulator, amplifier, sensitivity control subsystem, and air flow chamber (Figure 2).

Figure 2: The Amphenol SM-PWM-01C dust sensor is a complete signal-processing system that uses infrared detection of passing particles to generate pulse-width modulated signals corresponding to small (P1) and large (P2) particles. (Image source: Amphenol)
Within the sensor’s dust detection chamber, an infrared light emitting diode (IR LED) illuminates passing dust particles. A matched photodiode detects the reflected IR and the signal path converts the raw detector output to a pair of pulse-width modulated (PWM) output streams. Within the detection chamber, the sensor uses a resistor that elevates its temperature by over 40°C to create a constant convective flow of air. Consequently, the dust sensor needs to be mounted in a vertical position (as illustrated in Figure 1).
Airborne particles appear in a wide variety of sizes. For example, dust and pollen particles average about 20 μm, while particles from cigarette smoke are about 1 μm. As noted earlier, different sized particles bring concomitant health concerns. Particles at 2.5 μm and below represent a particular concern because these particles can penetrate the terminal bronchi all the way to the alveoli, potentially blocking the ability of red blood cells to take on oxygen. Consequently, the dust sensor developer finds a key requirement in particle size estimation.
Although the SM-PWM-01C dust sensor cannot count individual particles, it provides a method for detecting different relative size particles, using the transitions of the PWM waveform from its P1 and P2 output ports (Figure 3). At each output, an active low signal denotes detection of a particle. By comparing the transition times for P1 and P2 in software, engineers can estimate relative particle size.

Figure 3: The Amphenol SM-PWM-01C dust sensor’s P1 and P2 PWM outputs transition to low on detection of a particle, enabling a simple solution for estimating the relative size and concentration of particulate matter in the local environment. (Image source: Amphenol)
Particle density
Particle size is of course not the sole concern in PM detection. High concentrations of P10 and PM2.5 can have an immediate impact on morbidity. The dust sensor PWM signals provide a simple and effective method for determining relative concentration. Amphenol defines a low pulse occupancy (LPO) factor as the percentage of time each output signal is low compared to the corresponding measurement window as a whole. Thus, using Figure 3, P1 LPO = ∑(T1+T2+…+T8)/Top. Using its own testing facilities, Amphenol demonstrates a monotonically increasing relationship between LPO and dust concentration (Figure 4).

Figure 4: The Amphenol SM-PWM-01C dust sensor output translates to specific dust concentration values as determined by Amphenol. (Image source: Amphenol)
In its sample software package, Amphenol provides two different design patterns for determining concentration. In one approach, the software sample demonstrates use of a main loop that simply counts the number of transitions in the PWM output stream. Another approach provides a more flexible interrupt-driven approach able to work with other software operations (Listing 1). In the latter example, the software uses the PinChangeInterrupt library to implement a simple interrupt chain, separate from Arduino interrupts.
// Assign your channel in pins
#define PM10_IN_PIN 8 //input for PM10 signal, P2
#define PM2_IN_PIN 7 //input for PM2 signal, P1
// Assign your channel out pins - built in LED is 13
#define PM10_OUT_PIN 3
#define PM2_OUT_PIN 13
// using the PinChangeInt library, attach the interrupts
// used to read the channels
attachPCINT(digitalPinToPCINT(PM10_IN_PIN), calcPM10, CHANGE);
attachPCINT(digitalPinToPCINT(PM2_IN_PIN), calcPM2, CHANGE);
// simple interrupt service routine
void calcPM10()
{
// if the pin is low, it’s a falling edge of the signal pulse, so let’s record its value
if (digitalRead(PM10_IN_PIN) == LOW)
{
ulPM10_Start = micros();
}
else
{
// else it must be a rising edge, so let’s get the time and subtract the time of the rising edge
// this gives use the time between the falling and rising edges i.e. the pulse duration.
unPM10_InShared = (uint16_t)(micros() - ulPM10_Start);
// use set the PM10_ flag to indicate that a new PM10_ signal has been received
bUpdateFlagsShared |= PM10_FLAG;
}
}
void calcPM2()
{
if (digitalRead(PM2_IN_PIN) == LOW)
{
ulPM2_Start = micros();
}
else
{
unPM2_InShared = (uint16_t)(micros() - ulPM2_Start);
bUpdateFlagsShared |= PM2_FLAG;
}
}
Listing 1: This partial snippet from the Amphenol software package demonstrates the design pattern for an interrupt-driven approach for determining dust concentration. (Code source: Amphenol)
CO2 sensing
Like the Amphenol dust sensor, IR sensing lies at the heart of the Amphenol T6713 CO2 sensor. Instead of measuring reflection, however, the T6713 is a nondispersive infrared (NDIR) sensor, which measures the absorption of characteristic wavelengths of CO2 in air within the sensor chamber. In this sampling approach, ambient air simply diffuses into its sensing chamber. Consequently, these devices can seem idiosyncratic for developers used to immediate, accurate results.
One of the major challenges in working with CO2 sensors is their tendency to exhibit drift. Despite being built with the best components and design methods, any gas sensor will drift due to normal aging of its components, particularly its IR light source. In the past, recalibration required field engineers to physically attach sensors to gas tubes through tight tube fittings, significantly increasing the overall lifecycle cost for these sensors.
Amphenol avoids this manual recalibration requirement with a proprietary Automatic Background Calibration (ABCLogic) mechanism. Running on an MCU integrated in its NDIR CO2 sensors, the ABCLogic algorithm collects the lowest CO2 concentration level each day over a 14-day period. Because CO2 levels return over time to outside air levels, the algorithm takes these minimum levels as baseline readings. It ignores outliers that might arise even if the room were occupied overnight for several days in a row. The algorithm then analyzes those daily samples and corrects sensor calibration to account for any small, consistent change (or drift) above the baseline expected for outside air.
This self-calibration proves particularly effective immediately after installation. Any NDIR CO2 sensor that uses diffusion sampling is particularly sensitive to handling, the specific nature of the installation environment, and to the installation process. Even in taking normal breaths near the sensor during installation, the field engineer can affect the readings, requiring days to recover. Indeed, installation of multiple CO2 sensors within the same space can yield different results. With Amphenol’s ABCLogic algorithm, however, sensors self-correct to show consistent results over time (Figure 5).

Figure 5: On installation, even the same CO2 sensors (shown here as different colored lines) can drift due to the stress and conditions of the installation process (day 1), but Amphenol’s proprietary ABCLogic algorithm self-calibrates sensors to restore accuracy over time. (Image source: Amphenol)
Within a sensor system design, engineers can use the Amphenol T6713 CO2 sensor in a variety of output modes. The device can be set to generate a PWM output that is proportional to the range of the sensor. It also supports UART and I2C interface modes, enabling designers to use a simple, standard connection to a host MCU. The device uses the Modbus protocol for UART and I2C communications. In I2C mode, it wraps messages in I2C format rather than using the serial line protocol. The message format itself is simple, using a basic function code and contiguous bytes for address, register, or data as appropriate for request and response blocks (Figure 6).

Figure 6: The Amphenol T6713 CO2 sensor uses a simple message format for requests (top) and responses, requiring only a few lines of software to implement sensor operations. (Image source: Amphenol)
#define ADDR_6713 0x15 // default I2C slave address
byte data[6];
int CO2ppmValue;
void GetCO2PPM()
{
// start I2C
Wire.beginTransmission(ADDR_6713);
Wire.write(0x04); Wire.write(0x13); Wire.write(0x8B); Wire.write(0x00); Wire.write(0x01);
// end transmission
Wire.endTransmission();
// read report of current gas measurement in ppm
delay(2000);
Wire.requestFrom(ADDR_6713, 4); // request 4 bytes from slave device
data[0] = Wire.read();
data[1] = Wire.read();
data[2] = Wire.read();
data[3] = Wire.read();
// Serial.print("Func code: "); Serial.println(func_code);
// Serial.print("byte count: "); Serial.println(byte_count);
// Serial.print("MSB: "); Serial.print(data[2]); Serial.print(" ");
// Serial.print("LSB: "); Serial.print(data[3]); Serial.print(" ");
CO2ppmValue = ((data[2] & 0x3F ) << 8) | data[3];
//Serial.print(ppmValue);
//return ppmValue;
}
Listing 2: This function in the Amphenol software package uses the standard Arduino Wire library to access the CO2 sensor and read the results using the sensor’s simple message format. (Code source: Amphenol)
Finally, the T9602 humidity and temperature sensor integrates an ASIC, EEPROM, and capacitive polymer sensor in an IP67 module. The built-in system provides temperature compensation to achieve ±2% accuracy for relative humidity measurements and ±0.5°C accuracy across its -20°C to 70°C operating range. As with the T6713 CO2 sensor, the T9602 offers multiple interface options including I2C and pulse-density modulation (PDM) output. Its high level of integration and simple interface options allow developers to easily deploy the device in designs. On the software side, developers read and write to the T9602 using the same, simple Arduino Wire.write() and Wire.read() commands show in Listing 2.
Although the T9602 may represent a more familiar sensing paradigm to most developers, the evaluation kit hardware and software bring a similar level of simplicity to dust and CO2 sensing. By building on the widely-used Arduino software platform, the kit enables developers to work easily within a common environment.
Conclusion
Airborne particulate matter and elevated CO2 levels continue to raise concerns over their short-term and long-term impact on health and safety. As product manufacturers look to respond with air quality sensing capabilities, engineers find themselves confronted with a broad array of challenges unique to dust and CO2 measurement.
Using the Amphenol air quality evaluation kit, engineers can take advantage of sophisticated air sensors that handle these low-level details. In turn, engineers can instead focus on high-level air quality applications.
Reference
- Health effects of particulate matter, World Health Organization
聲明:各作者及/或論壇參與者於本網站所發表之意見、理念和觀點,概不反映 DigiKey 的意見、理念和觀點,亦非 DigiKey 的正式原則。