Improved printf Debugging
2025-09-29 | By Nathan Jones
The printf function (or the Serial.println function for some of us!) is a quick and useful way to see what a program is doing without needing to fire up a debugger. “Does my function ever reach this point? What’s the value of the loop counter on each iteration?” You’re only three lines of code away from seeing something like this in your terminal or Serial Monitor:

Beautiful!
You might be tempted afterwards to delete those print statements, but wait just a minute! If that code was useful right now, might it not be useful again in the future? Furthermore, wouldn’t it be nice if your print statements gave you even more useful information that you could use to solve even tougher bugs? Imagine setting up your print statements in such a way that:
- you can read your print statements and know immediately if there was an error and where it occurred,
- you can watch a graphical dashboard of your program,
- you can select which print statements (of the many scattered throughout your program) you see at any given point in time,
- and more.
If any of that sounds good to you, then come with me! We’re going to do two overarching things today that will maximize your use of printf/Serial.println:
- Make your print statements more meaningful
- Control when and what gets printed
Making Your Print Statements More Meaningful
Adding the file, function, and line number
The first improvement we can make is to print the file, function, and line number where a print statement occurs alongside each message. Adding that information to the above example would generate output that looked like this:
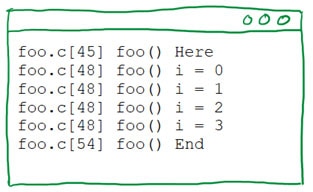
The file and line number are printed first, followed by the function in which the print statement was placed, followed by the actual message. This might seem a little unnecessary if we only have a few print statements in our code, but it will come in very handy once we start putting print statements in lots of other places!
We’ll accomplish this by writing a C-style macro that wraps a call to printf and that adds the file, function, and line number to any print statement we use1:
#define debug(buf, fmt, ...)\
  do{\
    printf(buf, "%s[%d] %s() " fmt "\n", __FILE__, __LINE__,\
      __func__, ##__VA_ARGS__);\
  } while(0)
Let’s unpack what’s going on here. First, using do{...}while(0) is a common way to wrap a function-like macro in C, specifically to avoid syntax and semantic errors when using that macro elsewhere in our code. Second, __FILE__, __LINE__, and __func__ are themselves macros (defined by your compiler) that expand out to the file name, line number, and function name in which they occur. With this macro, the C/C++ preprocessor would turn this code:

into this code:

Notice the last three arguments to printf, which the preprocessor put in for us.
How do I use printf on a microcontroller?
First, check the documentation for your specific IDE and MCU; some allow you to simply select a "Redirect printf to UART" checkbox during project setup. My preferred way to find information like this is to search for "
If no such option exists, you'll need to implement one of the C library functions _write(), fputc(), putc(), putchar(), __io_putchar(), etc., so that it outputs characters over UART. For example 2 3:
int _write (int file, const void * ptr, size_t len)
{
  uint16_t count = 0;

  // Replace "uart_putc" with your function to send out characters over UART
  //
  for(; *ptr != '\0' && count < len; count++) uart_putc(*ptr++);

  // Alt:
  //
  // uart_send_string(ptr, len);

  return count;
}
Which one(s) you need to rewrite, and how you correctly wire them into your compiled project, is toolchain- and system-dependent, though. For instance, the recommended solution for ST micros seems to be to use the following code4 5:
#ifdef __GNUC__
#  define PUTCHAR_PROTOTYPE int __io_putchar(int ch)
#else
#  define PUTCHAR_PROTOTYPE int fputc(int ch, FILE *f)
#endif /* __GNUC__ */

PUTCHAR_PROTOTYPE
{
  // Replace "&huart4" with the UART peripheral you're using
  //
  (void) HAL_UART_Transmit(&huart4, (uint8_t *) &ch, 1, 0xFFFFU);
  return ch;
}
Common "gotchas" when redirecting printf on an MCU are:
- _write() isn't called unless printf encounters a newline (\n): End all format strings with "\n", disable buffering6, or call fflush() whenever you want to see your output.
- Support for floating-point numbers is disabled by default: If printf isn't printing floating-point numbers, check your project settings for a checkbox to turn on support for floating-point numbers.
- printf fails silently due to lack of memory: Increase the size of your stack/heap.
In actuality, though, I would discourage the use of printf in favor of snprintf. snprintf is superior, IMO, for two reasons:
- It doesn't require any toolchain, compiler, or syscall acrobatics, like printf does; you don't need to rewrite any functions to get snprintf working.
- It supports asynchronous message transmission. printf is blocking, meaning it prevents the processor from doing any other work while a message is being sent. Although snprintf is also blocking, it completes rather quickly, letting us use an interrupt- or DMA-based system for transmitting messages, which frees up the processor significantly. More on this in a future article!
To use snprintf in the examples above, you'll just replace printf with the following code:
printf(buffer, "%s[%d] %s() " fmt "\n", __FILE__, __LINE__,\
      __func__, ##__VA_ARGS__);\
// Replace "uart_send_string" with your UART function\
// \
uart_send_string(buffer, MAX_MSG_LEN);
buffer and MAX_MSG_LEN should be defined at the top of your file, e.g.
const size_t MAX_MSG_LEN = 128;
char buffer[MAX_MSG_LEN+1] = {0};
Our macro is also variadic, by virtue of having ... and ##__VA_ARGS__. A variadic macro will replace ##__VA_ARGS__ with whatever text is put in place of the ellipses, similar to the way a variadic function7 works. For example, the C/C++ preprocessor would turn this code:

into this code:
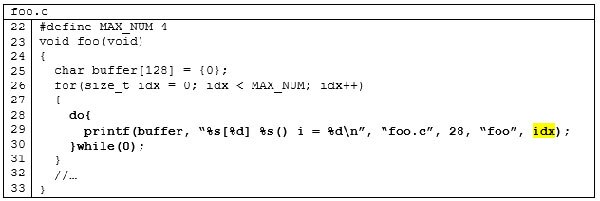
Notice in this case how the last argument in our macro, idx, gets added to the end of our call to printf. This lets us call the variadic functions printf or sprintf with variable arguments.
With this improvement, we can now be sure of exactly where in our code a message came from! We can easily zero in on specific parts of our code by searching through our print statements for specific files or functions (using Ctrl+F, grep, etc.). If we formatted our print statements to look like a CSV (e.g. "%s,%d,%s()," fmt "\n" [notice the commas in place of any spaces and brackets]) or JSON (e.g. "{\"file\": \"%s\", \"line\": %d, \"func\": \"%s\"," fmt "}\n"), we could even leverage a database or spreadsheet program to easily filter and sort our print statements.
Adding a "severity" level
The second improvement we're going to make is to add a “severity” level to each message. We’d like a message like “WARP CORE MELTING!!!” to show up slightly differently than “Login successful”, for instance. To do this, we’ll first create an enumeration for severity levels (along with a mapping to an appropriate ASCII character).
typedef enum {INFO=0, WARNING, ERROR, NUM_LVLS} debugLvl;
char debugLvlToChar[NUM_LVLS] = { [INFO] = 'I', [WARNING] = 'W',
                                  [ERROR] = 'E' };
(Alternatively, an X-macro 8 would help ensure that the enumeration and array are never out of sync with each other.)
Then we’ll add the severity to our debug macro (changes in bold).
#define debug(level, buf, fmt, ...)\
  do{\
    printf(buf, "[%c] %s[%d] %s() " fmt "\n", debugLvlToChar[level],\
      __FILE__, __LINE__, __func__, ##__VA_ARGS__);\
  } while(0)
To use our new debug macro, we’ll just put the severity level of our message as the first argument, e.g., debug(WARNING, “Input value excessively high [%d]\n”, val). A sample log might look like this:
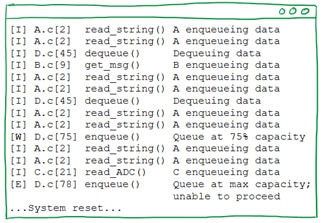
Now all of our debug messages will get prefixed with a letter to indicate whether it’s REALLY important ([E]rror), kind of important ([W]arning), or just informational ([I]nfo). Using our search techniques from before, we can easily zero in on all of the errors or all of the warnings that our program is printing (or just the errors in this file, or just the errors in this function, …). Of course, you’re not limited to just info, warning, or error messages. Other types of messages you might want to identify could be TRACE, DEBUG, FATAL, STATS, etc.
Cool Stuff to Do Next
Strew print statements liberally throughout your code
If there’s anything you think would be useful to know or have a record of while your program is running, put a print statement there! Performance considerations notwithstanding, the more print statements you have, the better your understanding will be of what your program is actually doing.
But won't all those print statements slow down my code?! Yes, for an MCU running at 48 MHZ that's sending out 32-character messages over UART at 115200 baud, each message would represent over 133,000 clock cycles. On something like a Cortex-M0+ processor, this would correspond veeeery roughly to one message every ~13k lines of C code, which is veeeery infrequently. However, there are ways to mitigate this, which we'll discuss in the next article!
Consider adding other useful pieces of information to your print statements
By printing a timestamp of when each message was sent/received, you could glean useful information about how often functions were running, how long it's taking your program to execute each loop, etc.
By printing the value of the link register (or by printing “Start of foo” and “End of foo” at the top and bottom of each function), you would have enough information to generate a call graph of your program. Similarly, if an error were to occur, you’d know not only in which function it arose but also the chain of function calls that were made that led to that error!
Show live system stats with a Custom GUI
If the information you're streaming off of your microcontroller includes system statistics such as ADC values, number of button presses per second, CPU usage, etc., you could use something like Serial Studio or your own GUI application to consume these strings, extract the values you care about, and then plot them on a chart for a live view of your data!
Go remote
Why limit yourself to just UART? If your microcontroller has (or could have) a WiFi radio, then you could send your debug messages over that channel and have the ability to see them wirelessly!
Controlling When and What Gets Printed
Adding a global flag to disable all messages
Now that we're adding a bunch of useful print statements to our code, we might find ourselves inundated with information. Too much information could be a bad thing, drowning out the useful information that we actually want to see. Plus, at some point, we might want to turn off this debug stream entirely (like for a final production run of our code). In this section, we'll add code to control if and when these print statements are actually executed, starting with a flag that will let us turn them off entirely.
To do that, we'll introduce a macro called DEBUG that defaults to the value 1.
#ifndef DEBUG
#  define DEBUG 1
#endif
This value can be easily overridden by adding -DDEBUG=0 to your compiler options when you're ready to eliminate all of your print statements.
Next, we'll use the value of DEBUG to control whether debug(), our printing macro, actually resolves to anything (or is just compiled out of our program entirely).
#if DEBUG==1
#  define debug(level, buf, fmt, ...)\
     do{\
       printf(buf, "[%c] %s[%d] %s() " fmt "\n", debugLvlToChar[level],\
         __FILE__, __LINE__, __func__, ##__VA_ARGS__);\
     }while(0)
#else
#  define debug(level, buf, fmt, ...)
#endif
Nice! A global switch to turn print statements on or off.
Control which pieces of information get printed
Now let's add some code to control which pieces of information get printed. This will let us see all of the ERROR messages if we need to debug something, for instance (and just the ERROR messages), without needing to wade through any (less important) INFO or WARNING messages. In fact, we'll add code that will let us control what severity levels we want to filter out, allowing us to control whether we print
- all messages (INFOs, WARNINGs, and ERRORs),
- just WARNINGs and ERRORs, or
- just ERRORs.
To do this, we'll add a global variable to hold the level of information we want to see.
debugLvl g_debugLvl = INFO;
Additionally, we'll modify our debug macro so that it only prints messages whose level (i.e., INFO, WARNING, or ERROR) is greater than or equal to the global variable.
#define debug(level, buf, fmt, ...)\
  do{\
    if(level >= g_debugLvl){\
      printf(...);\
    }\
  } while(0);
This code, by default, prints everything, since INFO, WARNING, and ERROR messages all have values greater than or equal to INFO. By setting g_debugLvl to WARNING or ERROR (and then recompiling your program), you can limit what gets printed to just the more important messages.
More Cool Stuff to Do Next
Make g_debugLvl controllable at run-time
Needing to recompile and reflash anytime you want to change the logging level is a chore, so instead, make it controllable! One straightforward way to do this would be to connect a pair of GPIO pins to power or ground and then read their values in your code; their binary value would be used to set the logging level. For instance, if you connected your GPIO to GROUND and GROUND (i.e., "00"), this would correspond to a logging level of INFO, whereas if you connected them to POWER and GROUND (i.e., "10" or "2"), the logging level would be set to show only ERROR messages. You could read the GPIO pins once at the top of main(), or you could read them repeatedly as your program is running.
A more advanced option would be to set this global variable using a command-line interface (CLI). To do this, you'll need to read characters from something like the UART port and then decode them to set the logging level appropriately. I'd recommend turning off the local echo in your terminal program so your inputs to your microcontroller don't garble the stream of print statements coming off of that same device.
Set log levels by module
If you're following good design practices, your code is probably separated into modules (one for your display, one for your motor control, one for each of your tasks, etc.). With a single global logging level, each module will report every message it produces at that level; if you want to see the ERROR messages from the motor control module, you have to see all error messages from every other module as well! An improvement to this would be to allow each module to have its own individual logging levels. Instead of one global logging level,
debugLvl g_debugLvl = INFO;
Each module would have its own.
typedef enum {DISPLAY, MOTOR, TASK_A, TASK_B, NUM_MODULES} modules;
debugLvl g_debugLvls[NUM_MODULES] = {INFO};
Module-specific severity levels could be set like this:
g_debugLvls[MOTOR] = ERROR;
It would also be nice to turn off debug messages for one or more modules, so let's add a NONE or "no messages" value to our severity levels.
typedef enum {INFO=0, WARNING, ERROR, NONE, NUM_LVLS=NONE} debugLvl;
Now we can turn off all messages for a given module like this:
g_debugLvls[DISPLAY] = NONE;
The debug macro also needs to know which module is trying to print a message so that it can then check if the given message meets or exceeds that module's severity level.
#define debug(module, level, buf, fmt, ...)\
  do{\
    if(level >= g_debugLvls[module]){\
      printf(buf, "[%c] %s[%d] %s() " fmt "\n", debugLvlToChar[level],\
        __FILE__, __LINE__, __func__, ##__VA_ARGS__);\
    }\
  } while(0)
Now you can choose to see just the ERROR messages from the motor control module!
Select which types of messages to send individually
Some message types don't fit onto a neat one-dimensional spectrum of severity. What if you want to turn on and off the ability to see STATS messages, regardless of whether you're also printing ERROR messages or ERROR and WARNING messages? In other words, what if we wanted to change our "radio button"
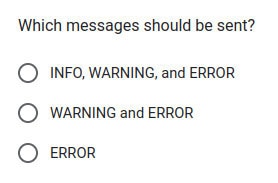

Doing so will require changing our g_debugLvl variable into an array, with one element for each debug message type (for storing, individually, which message types are allowed to print),
bool g_debugLvls[NUM_LVLS] = {true};
and also changing slightly our debug macro to see if a message type has been enabled before printing it.
#define debug(level, buf, fmt, ...)\
  do{\
    if(g_debugLvls[level]){\
      printf(buf, "[%c] %s[%d] %s() " fmt "\n", debugLvlToChar[level],\
        __FILE__, __LINE__, __func__, ##__VA_ARGS__);\
    }\
  } while(0)
(If memory usage is of a concern for you, feel free to rewrite this code using bit positions in a single integer!)
One downside to this, though, is that now we also have to set our severity levels (i.e., INFO, WARNING, and ERROR) individually. It would be neat to be able to turn some message types on or off (e.g., STATS) while others are set by level (e.g., INFO/WARNING/ERROR). But that's an exercise I'll leave for the interested reader!
Conclusion
Using printf/snprintf/Serial.println to see what's happening inside your microcontroller is a very useful tactic, and it can be made even more useful by adding the file, function, and line number where the print statement occurred, as well as the "severity" of the message. This gives you a ton of useful information and is easily searchable using Ctrl+F, grep, etc.
By adding a global flag and logging level to your code, you can also then control how much information to send from your system, whether all messages or just the most important ones, and even whether the debug code is emitted by the assembler at all into your final executable.
The final code ("Cool Stuff to Do Next" not included) is short enough to show you right here.
#ifndef DEBUG
#  define DEBUG 1
#endif

typedef enum {INFO=0, WARNING, ERROR, NUM_LVLS} debugLvl;

char debugLvlToChar[NUM_LVLS] = { [INFO] = 'I', [WARNING] = 'W', [ERROR] = 'E' };

debugLvl g_debugLvl = INFO;

#if DEBUG==1
#  define debug(level, buf, fmt, ...)\
     do{\
       if(level >= g_debugLvl){\
         printf(buf, "[%c] %s[%d] %s() " fmt "\n", debugLvlToChar[level],\
           __FILE__, __LINE__, __func__, ##__VA_ARGS__);\
       }\
     } while(0)
#else
#  define debug(level, buf, fmt, ...)
#endif
If you've made it this far, thanks so much for your time, and happy hacking!


