Make Fast, Accurate, and Complete Waveform Measurement on Your Oscilloscope
資料提供者:DigiKey 北美編輯群
2017-11-22
Like most test tools, modern digital storage oscilloscopes (DSOs) have evolved to meet the demands of designers and test engineers that require a balance of performance, features, and usability. However, three fundamental features – graticules, cursors, and automatic measurement parameters have been kept intact because when applied correctly, they are extremely valuable to designers under ever increasing time-to-market pressure.
This article will describe the proper use and application of these mainstays of the modern DSO, and provide a useful definition of measurements for reference.
The three indispensable tools of modern DSOs
The oscilloscope is a voltage responding measuring instrument that incorporates three basic measuring tools. These tools evolved sequentially during the development of the instrument. The oldest is the display graticule, or grid, on the instruments display screen. The second tool, introduced during the development of the oscilloscope was the cursor, or marker. The third and final addition to this toolset was measurement parameters. These were added with the introduction of the digital oscilloscope. The fact that these tools were not replaced as newer means became available is a testament to their usefulness. Let’s go through them one by one to understand why, and how to make the best use of them.
Screen graticule
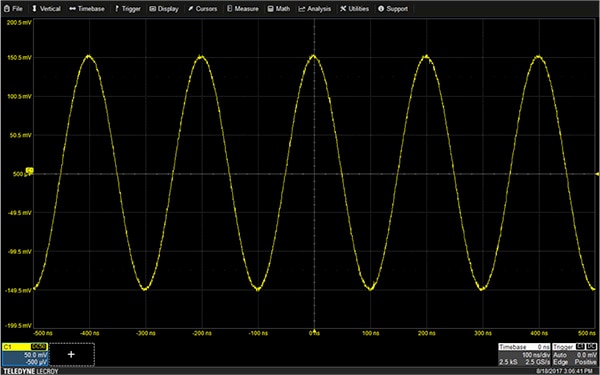
The most primitive measurement technique is to use the graticule on the screen and count boxes. This method is used primarily for quick estimates of amplitude and time measurements. The display graticule or grid was the first measurement tool to appear on the oscilloscope. Measurements of a waveform are made by noting the number of grid boxes a waveform covers and then multiplying by the appropriate scale factor. This can be done for a waveform acquired on a Teledyne LeCroy HDO 4104A, which shows five cycles of a sine wave (Figure 1).

Figure 1: A typical oscilloscope display grid. The vertical scale factor read from the channel 1 (C1) trace descriptor is 50 millivolts (mV) per division, and the horizontal scale factor, shown in the Timebase descriptor, is 100 ns per division. (Image source: DigiKey)
The sine wave trace covers six divisions vertically. Multiplying that by the vertical scale factor of 50 millivolts (mV) per division, found in the channel 1 descriptor box, the sine wave amplitude is 300 mV peak to peak. Similarly, the period of the sine wave covers two horizontal grid boxes, at 100 nanoseconds (ns) per division from the Timebase descriptor box, resulting in 200 ns. Counting boxes seems primitive, but it is a very fast way to make a basic measurement. Most oscilloscope users become adept at using this method to verify basic assumptions about the waveform being measured and assuring that the oscilloscope is set up correctly.
Cursors
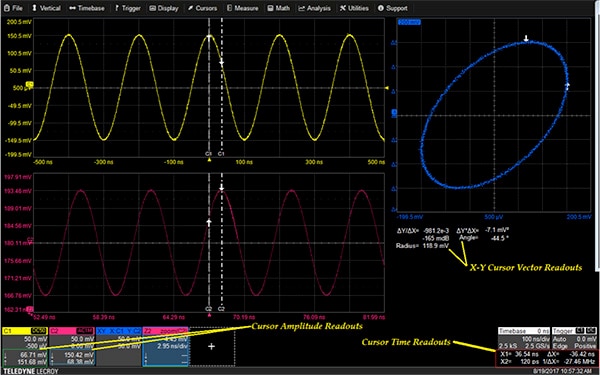
Cursors are markers, in the form of user placeable display lines, which have associated amplitude and time readouts. Cursors are positioned over points on the trace where measurements are desired. Cursor readouts show amplitudes, times, and time differences between the cursor marker lines (Figure 2).

Figure 2: Trace and X-Y cursors showing the cursor readout fields for amplitude and time locations (Image source: DigiKey)
Available cursor types are Horizontal, Vertical, and both. The cursor type shown is horizontal, which includes both Horizontal and Vertical readouts of the points marked by the vertical cursor lines and arrows. The amplitude readouts appear within the trace descriptors of each channel displayed. The horizontal readouts are located under the Timebase and Trigger descriptor boxes. The horizontal readouts show absolute cursor location relative to the trigger point, the time difference between the cursors (Dt), and the reciprocal of the time difference (frequency).
The operation of cursors extends to their use on X-Y displays. In addition to the normal cursor readouts of amplitude and time, users gain readouts of vector angle (angle from down arrow to the up arrow) and the magnitude (radius from down arrow to the up arrow) from the X-Y display. These vector readouts appear under the X-Y display. Relative cursors on the X-Y display read vector difference, including error vector magnitude (EVM) and phase angle.
A useful feature of the X-Y cursors is that the cursor positions on the X-Y display are tracked on the X-T and Y-T components. Thus, any anomaly on the X-Y display can be instantly traced to the exact point on the component traces.
Measurement parameters
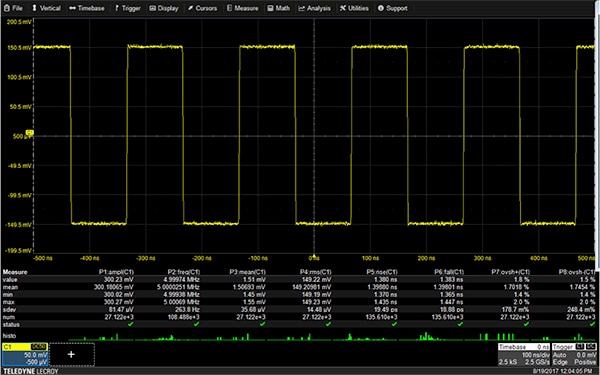
The most accurate way to measure a waveform is to use the automatic measurement parameters available in the oscilloscope (Figure 3).

Figure 3: Measurement parameters for a Teledyne LeCroy HDO 4104A oscilloscope showing the maximum eight parameter readouts, including statitics and ‘Histicons’. (Image source: DigiKey)
The Teledyne LeCroy 4104A and WaveSurfer 510 oscilloscopes offer over 30 basic measurements that are standard, and can display up to eight or six parameters at a time, respectively. The WaveSurfer 3024 has 24 standard measurements and displays up to six at one time. Additional parameters are available with specific analysis options.
Timing parameters are measured for every cycle of the displayed waveform. This capability is known as “all instance” measurement. Amplitude parameters accumulate a single value for each acquisition. The measurement table can display the last value of each measurment, or can show a history of all the measurements via parameter statistics. The figure shows that parameter statisitics are on. Available parameter statistics include the mean, minimum, maximum, and standard deviation. The total number of acquisitions (sweeps) included in the parameter statistics is also displayed. It provides a basis for statistical examination.
Histicons, or iconic histograms, can be turned on to show the distribution of measured values for each parameter. Statistics and histicons help understand the variation of the parameter values over multiple measurements.
Further understanding of the variation in measurement values is the trend function. Trend functions plot measurement parameter values in the order the measurements are made. The vertical axis units match the units of the measurement and the horizontal value is the measurement number in the sequence (Figure 4).

Figure 4: An example of a trend plot of the instantaneous frequency of a frequency-modulated sine wave. Frequency is measured for every cycle and the values are plotted in the order the measurements are made in math trace F1. (Image source: DigiKey)
The acquired signal is a frequency-modulated sine wave; the frequency of the signal is measured on a cycle-by-cycle basis and plotted as a trend plot in math trace F1. The vertical axis of this trend plot is in units of Hertz (Hz), while the horizontal axis is the measurement order number. Trend plots can have 20 to 1,000,000 points in a 1-2-5 progression. The plots are synchronous with the source trace, but only if they are plotting the same number of points.
Status Icons, such as the green check marks under the statistics table, indicate the status of parameter calculations, including error conditions. Readouts are blanked if insufficient data is available.
The measurements can be gated so that only data between the user-defined measurement gates are included in the measurements. This is useful in applications such as the analysis of data busses where address and data waveforms share the same signal paths. Measurement gates can be located so as to make measurements only on the desired mode.
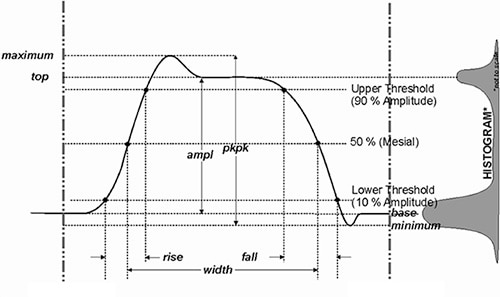
Pulse measurements are based on IEEE standard 181. This standard specifies that pulse measurements apply statistical analysis to minimize the effects of noise on the measurements of pulse waveforms (Figure 5).

Figure 5: IEEE Standard 181 histogram sample of a pulse measurement. The histogram of a pulse will exhibit two peaks. The mean of these peaks determine the top and base voltage values of the pulse minimizing the effect of noise. (Image source: Teledyne LeCroy).
The IEEE standard specifies that the waveform samples be histogrammed. The histogram of a pulse will have two peaks. The mean value of the higher peak is the pulse top and the mean value of the lower peak is the pulse base. Using these mean values diminishes the effect of noise on determining the pulse amplitude. Hence the period, width, overshoot, rise time and fall time are computed more accurately.
If the histogram fails to show two distinct peaks, then the oscilloscope indicates, via the status icons, that the waveform is not a pulse and amplitude measurements are based on maxima minus minima or peak-to-peak value.
Other specialized measurements are based on similar industry measurement standards.
What follows is a useful table that lists the standard parameters for the Teledyne LeCroy HDO series oscilloscope. It also serves as a good measurement definition and reference:
| Amplitude | Difference between the top and base of a bimodal signal, if not bimodal maximum - minimum | |
| Area | Area under a waveform | |
| Base | Value of the lower most probable state in a bi-modal waveform | |
| Delay | Time between trigger and first edge at 50% amplitude | |
| Δ period@level | Adjacent cycle deviation (cycle to cycle period jitter) of each cycle in a waveform | |
| Δ time@level | Time between selectable levels between two waveforms | |
| Duty cycle | Width as percentage of period | |
| Duty@level | Duty cycle jitter at selected level | |
| Edges@level | Number of edges in waveform | |
| Fall time | Duration of falling edge from 90 - 10% | |
| Fall 80 - 20% | Duration of falling edge from 80 - 20% | |
| Frequency | Frequency for each cycle in a signal at 50% level | |
| Freq@level | Frequency at a specific level and slope for every cycle in waveform | |
| Maximum | Measures highest point in a waveform | |
| Mean | Average of all data values in the input signal | |
| Minimum | Measures the lowest point in a waveform | |
| Overshoot− | Amount of overshoot following a falling edge, as percentage of amplitude | |
| Overshoot+ | Amount of overshoot following a rising edge, as percentage of amplitude | |
| Peak to peak | Difference between highest and lowest points in waveform | |
| Period | Period of a cyclic signal measured as time between 50% levels | |
| Period@level | Period at a specified level and slope for every cycle in waveform | |
| Phase | Phase difference between two selected signals | |
| Rise | Duration of rising edge from 10 - 90% | |
| Rise 20 - 80% | Duration of rising edge from 20 - 80% | |
| RMS | Root Mean Square of data | |
| Skew | Time of clock1 edge minus time of nearest clock2 edge | |
| Standard deviation | Standard deviation of the data between the cursors | |
| Time@level | Time from trigger to edge at a specified level | |
| Top | Higher of two most probable states, the lower being base | |
| Width + | Width of a positive pulse at 50% crossings | |
| Width - | Width of the negative pulse at 50% crossings |
These measurements are all well-defined and made automatically and with greater accuracy than is possible by the other measurement techniques.
Conclusion
Automatic measurement parameters offer the most accurate measurements available on the oscilloscope, while cursors offer greater flexibility in measurement. For example, measuring the duration of a pulse burst is very easy to do with cursors, but would require a custom parameter. Similarly, grid estimation using the graticule is the fastest method for getting basic measurements, and ideal for verifying test settings quickly.
Thankfully, manufacturers of modern digital oscilloscopes have managed to retain the best of all three worlds to help designers shorten their required test time.

聲明:各作者及/或論壇參與者於本網站所發表之意見、理念和觀點,概不反映 DigiKey 的意見、理念和觀點,亦非 DigiKey 的正式原則。


