Mfr Part # 2279
64X32 RGB LED MATRIX - 3MM PITCH
Adafruit Industries LLC
License: Attribution Non-commercial LED / Display Drivers Microcontrollers AdaBox ESP32
I've recently found out that the ISS is going to be decommissioned at the end of this decade. Looking at the Adafruit LED Matrix display sitting on my desk, I decided to make a wall display that shows the current position of the ISS!
The international space station, also known as the ISS, is a large, manned spacecraft that orbits earth at an altitude of around 400km. It's frequently used to perform scientific research across many fields in the unique micro gravity conditions of space. It orbits Earth approximately once every 90 minutes.
A Picture of the ISS orbiting Earth. Credit: NASA
To find the position of the ISS, we will use a handy REST API. A REST API is a quick way to get information from a server across the internet. You can learn more about rest APIs here.
If we navigate to this API link on any browser, you will see the following output, which shows the coordinate position of the ISS on the globe!
Your browser's output may look slightly different. I'm using Firefox, which neatly formats the data for me.
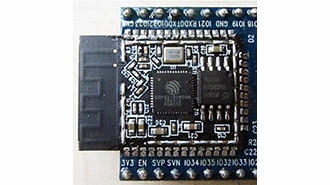
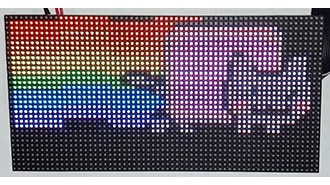
We'll come back to this later. For now, let's focus on the hardware. We will be using the Adafruit Matrix Portal kit to create our display. This kit comes with an Adafruit Matrix portal M4 (an ESP32 S3-powered interface for the display) and the actual LED matrix itself.
We will need to use the Matrix Portal M4 to not only control the display, but also grab the data from the REST API. The Matrix Portal M4 has internet capability, which we can interface with through a convenient Adafruit library. We can also use Adafruit's library to control the display, making our lives much easier.
The Adafruit Matrix Portal M4, attached to an Adafruit LED matrix display.
The Matrix Portal can be programmed in MicroPython or C. Since this project doesn't require the display to be updated quickly, we will use MicroPython for its wide array of libraries and ease of use. To program the Matrix Portal, simply plug it into your laptop and it'll appear as a separate drive. You can drop all the relevant files into this, and it will upload to the Matrix Portal every time you save. Keep in mind that the microcontroller will only execute the code written and included in the "code.py" file inside the drive.
With the setup out of the way, let's walk through the code. You can grab the code at this Github Repo.
First we set up some relevant variables.
#--| User Config |-----------------------------------------

MATRIX_WIDTH = 64

MATRIX_HEIGHT = 32

BACKGROUND_COLOR = 0x000000 #Background color

DOT_COLOR = 0xFF0000 # trailing particles

FILENAME = "map.bmp"

DATA_URL = "http://api.open-notify.org/iss-now.json"

#----------------------------------------------------------

#Network setup

secrets = {

    "ssid": os.getenv("CIRCUITPY_WIFI_SSID"),

    "password": os.getenv("CIRCUITPY_WIFI_PASSWORD"),

}
You'll notice some interesting setup items in this code. First is the map.bmp file. This file is a BMP image of a world map in black and white. We'll make use of this image to project a world map onto our display.
Since we are trying to project the spherical earth onto a rectangular display, care was taken to choose a map projection that doesn't distort distances. As a result, some of the continents may be slightly distorted. If you'd like to learn about map projections, here's a great resource.
The map.bmp file. The resolution is 32x64, which corresponds to our LED matrix's size.
Intelligently choosing the map projection makes our life easier later in the code when we'll have to convert the ISS's coordinates to a position on our display.
In the code snippet above, you'll also notice the "secrets" object. Since this project pulls data from the internet, our ESP32 will have to connect to a WiFi network. The settings.toml file contains a field to enter both your WiFi SSID and password.
After that, we'll initialize our ESP32's pins and network connection, as well as the display itself.
esp32_cs = DigitalInOut(board.ESP_CS)

esp32_ready = DigitalInOut(board.ESP_BUSY)

esp32_reset = DigitalInOut(board.ESP_RESET)

if "SCK1" in dir(board):

    spi = busio.SPI(board.SCK1, board.MOSI1, board.MISO1)

else:

    spi = busio.SPI(board.SCK, board.MOSI, board.MISO)


esp = adafruit_esp32spi.ESP_SPIcontrol(spi, esp32_cs, esp32_ready, esp32_reset)

pool = adafruit_connection_manager.get_radio_socketpool(esp)

ssl_context = adafruit_connection_manager.get_radio_ssl_context(esp)

requests = adafruit_requests.Session(pool, ssl_context)

while not esp.is_connected:

    try:

        esp.connect_AP(secrets["ssid"], secrets["password"])

    except OSError as e:

        print("could not connect to AP, retrying: ", e)

        continue

# matrix and displayio setup

matrix = Matrix(width=MATRIX_WIDTH, height=MATRIX_HEIGHT, bit_depth=1)

display = matrix.display

display.rotation = 180
With all the initializations done, we'll need to set up the display itself. In this project, we'll be using the Adafruit displayio library, which provides an easy interface to making digital display elements.
# Create a TileGrid and group to hold the map background

bitmap = displayio.OnDiskBitmap("map.bmp")

map = displayio.TileGrid(bitmap, pixel_shader=bitmap.pixel_shader)

map_group = displayio.Group()

map_group.append(map)

#Create a TileGrid to hold the ISS dot

ISS_bitmap = displayio.Bitmap(1,1,2)

palette = displayio.Palette(2)

palette[0] = 0x000000

palette[1] = DOT_COLOR

ISS = displayio.TileGrid(ISS_bitmap, pixel_shader = palette)

iss_group = displayio.Group()

iss_group.append(ISS)

ISS_bitmap.fill(1)

# Create a Group to hold the TileGrid

group = displayio.Group()

# Add the ISS and map TileGrid to the Group

group.append(map_group)

group.append(iss_group)

# Add the Group to the Display

display.root_group = group

#Rescale the lat and long to be within the frame

height = display.height-1

width = display.width -1
The Adafruit displayio library is very feature-rich. In our implementation, we will use the image of the world as a "background layer" and then project the ISS's location as a dot on top.
To do this, we load the BMP as a TileGrid object and define the colors. Then, we define the ISS's location as a single pixel. Finally, we stack the two layers into a single group, with the ISS TileGrid over the map TileGrid. This group is added to the display and shown.
The last part of the code is where the magic actually happens.
#Intialize the first position

r = requests.get(DATA_URL)

print(r.json())

iss_loc = r.json()

if(iss_loc['message'] == 'success'):

    lat = float(iss_loc["iss_position"]['latitude'])

    long = float(iss_loc["iss_position"]["longitude"])

    lat = (((-1*lat)+90)/180)*(height)

    long = (((long)+180)/360)*(width)

    ISS.x = round(lat)

    ISS.y = round(long)


while True:

    with requests.get(DATA_URL) as response:

        iss_loc = response.json()


    print(response.json())

    if(iss_loc['message'] == 'success' and iss_loc != None):

        lat = float(iss_loc["iss_position"]['latitude'])

        long = float(iss_loc["iss_position"]["longitude"])

        lat = (((-1*lat)+90)/180)*(height)

        long = (((long)+180)/360)*(width)

        #Use rescaled lat and long to set the ISS Sprite

        newX = round(long)

        newY = round(lat)

        if(ISS.x != newX or ISS.y != newY):

            ISS.x = newX

            ISS.y = newY

    time.sleep(30)
First, we use the requests method from the adafruit_requests library to ask the ISS tracking API for an update on the ISS's location. After receiving the request, we parse it into a JSON object.
#Intialize the first position

r = requests.get(DATA_URL)

print(r.json())

iss_loc = r.json()
We then check the JSON object's message field to ensure we actually got a successful message. After that, we pull the latitude and longitude into local variables.
if(iss_loc['message'] == 'success'):

    lat = float(iss_loc["iss_position"]['latitude'])

    long = float(iss_loc["iss_position"]["longitude"])
Since the latitude varies from -90° to +90° and the longitude ranges from -180° to +180°, we can do some simple math to linearly rescale these numbers within the range of our display (0-32 and 0-64).
    lat = (((-1*lat)+90)/180)*(height)

    long = (((long)+180)/360)*(width)
Finally, we round these numbers and move the location of the ISS pixel on the display to that location.
    ISS.x = round(lat)

    ISS.y = round(long)
After the first initialization, the while loop repeats this code every 30 seconds to fetch a fresh location from the ISS API.
while True:

    with requests.get(DATA_URL) as response:

        iss_loc = response.json()


    print(response.json())

    if(iss_loc['message'] == 'success' and iss_loc != None):

        lat = float(iss_loc["iss_position"]['latitude'])

        long = float(iss_loc["iss_position"]["longitude"])

        lat = (((-1*lat)+90)/180)*(height)

        long = (((long)+180)/360)*(width)

        #Use rescaled lat and long to set the ISS Sprite

        newX = round(long)

        newY = round(lat)

        if(ISS.x != newX or ISS.y != newY):

            ISS.x = newX

            ISS.y = newY

    time.sleep(30)
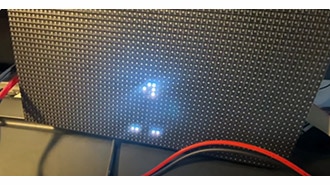
With the code done, it's time to assemble the system.
Plug in the matrix portal to the LED display
Plug in the power wire from the matrix portal to the LED display
Plug in a USB power supply
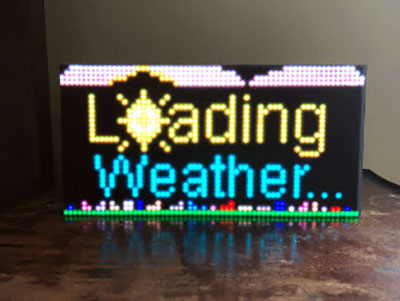
And voila! Just like that, we have a fully working LED display that tracks the ISS. Feel free to add a frame or any other decorations before mounting it to your wall!