The Professional’s Guide to Debugging Tools and Techniques for IoT Devices
Contributed By DigiKey's North American Editors
2021-03-23
The development of an embedded system, where the software and hardware must play nicely together, has become extremely complex and challenging, even for what may seem like the simplest Internet of Things (IoT) devices. So much so, that when something goes wrong—as it inevitably will—debugging times usually aren’t a few hours but instead can take weeks or months. These delays add development costs, prevent a product from getting to market on time, delay manufacturing schedules, and destroy supply chains and business plans.
The best way to decrease the time spent debugging and keeping a project on track is to use a combination of hardware debugging tools and freely available software to gain insights into how a system is performing and where the issues are occurring. As such, for both professionals and hobbyists alike, having the right tools for the job dramatically helps in getting it done quickly and correctly.
This article will discuss development tools and software that can be used to debug and analyze the performance of an IoT device. It will use a development board from STMicroelectronics as an example IoT device, and use SEGGER Microcontroller Systems’ tools and software to understand and debug the system. It will also discuss several tips and tricks on how to minimize debug time and deliver an IoT project on schedule.
The typical IoT device to debug
IoT devices have become prevalent in nearly every industry, from the smart home to industrial monitoring control. Despite the variety of applications, there are several typical components that an IoT device is going to have. These include:
- A microprocessor
- A radio for connectivity
- Sensors
A developer isn’t going to want to custom spin their own board to explore debug techniques or to test out pieces of their application code. It’s just too time consuming. Instead, it’s wiser to work on a low-cost development board like STMicroelectronics’ B-L4S5I-IOT01A Discovery Kit for IoT Node. This has almost everything found on a typical IoT device (Figure 1).
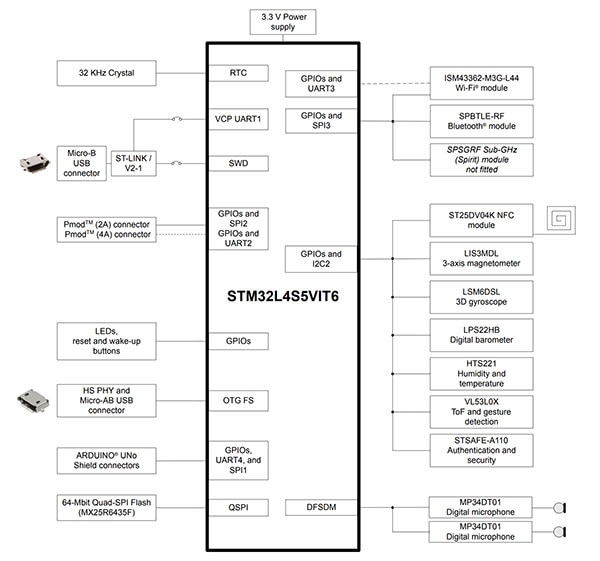 Figure 1: The STMicroelectronics B-L4S5I-IOT01A Discovery Kit for IoT Node includes all the components typically required in an IoT device. (Image source: STMicroelectronics)
The board includes the STM32L4S5VIT6, an Arm® Cortex®-M4 microcontroller running at 120 megahertz (MHz). This is supported by up to 2 megabytes (Mbytes) of flash and 640 kilobytes (Kbytes) of RAM. Importantly for the purposes of this exercise, the board includes Wi-Fi and a plethora of sensors that can be used to quickly build a mock IoT test device.
Professional debugging hardware tools
Nearly every development board comes with an on-board JTAG/SWD interface so developers don’t have to go out and get their own programmer. Instead, they can work with the development board right out of the box. While this is great for marketing purposes, it is not great for real engineering: on-board debuggers often are dramatically scaled down versions that have limitations, such as the number of breakpoints available and the interface baud rate. To the uninitiated, these limitations may not seem like a big deal, but having unlimited breakpoints avoids having to constantly enable and disable breakpoints, and fast baud rates are needed for application tracing (more on tracing in the software tools section).
There are several different tools available that can provide a professional debug experience, but the tools themselves are only half the solution. The tools need to be supported by good software. One set of tools that stands out from both a hardware and software perspective is the SEGGER J-Link series. This series has a debugger version for nearly any type of developer, ranging from students and hobbyists to hardcore professionals.
There are two models that experience has shown to be the most useful for the general developer: the J-Link Base and the J-Link Ultra+ (Figure 2). Form factor wise, the two units are identical, but the J-Link Ultra+ does provide a developer with faster download speeds to RAM (3 Mbytes/s versus 1.0 Mbyte/s) and a faster SWD interface speed (100 MHz rather than 30 MHz). The faster speeds make all the difference when a developer wants to trace their application to get insights into performance, RTOS behavior, and debug their system.
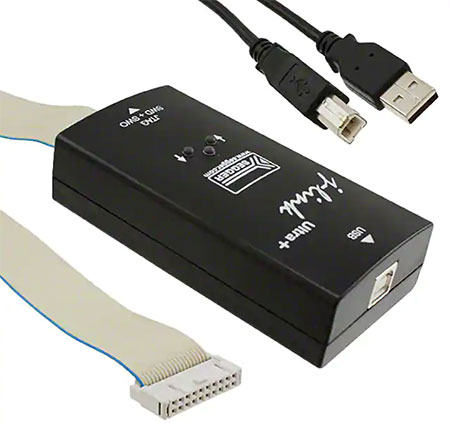 Figure 2: The SEGGER J-Link Ultra+ provides developers with an enhanced debugger experience through a 50 MHz target interface. (Image source: SEGGER Microcontroller Systems)
The nice thing about the J-Link and the B-L4S5I-IOT01A development board is that the two can be connected through a Tag-Connect TC2050-IC-NL cable and the TC2050-CLIP-3PACK retainer clip. These allow for a debugger to be connected to the development board through the “nails pad” (Figure 3). It may be necessary to adapt the J-Link’s 20-pin connector to the 10-pin connector on the TC-2050 cable. One option that can be used for this is the 8.06.04 J-Link 10-Pin Needle Adapter.
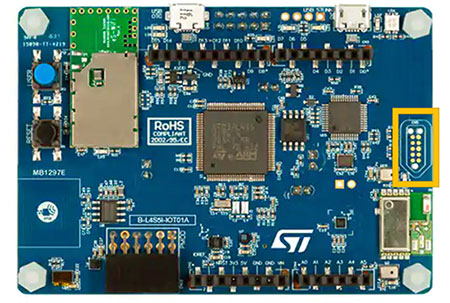 Figure 3: On the B-L4S5I-IOT01A development board, the Tag-Connect cable assembly can be connected through a bed-of-nails-like pc board footprint (right). (Image source: STMicroelectronics)
Once a developer has this path closed on the hardware side, they can use the software tools to analyze and debug their application.
Professional debugging software tools
There are quite a few software tools that work quite well with the SEGGER J-Link tools, which are surprisingly not provided by SEGGER. The following will take a look at several of these free tools and see how developers can use each to debug their software.
First up is J-Scope. J-Scope is an oscilloscope-like tool that displays variable values over time. Developers can monitor a single variable or several dozen variables. Note, however, as more variables are monitored, fewer samples can be taken before the sample buffer overflows and data is lost.
Variables are selected by providing J-Scope with the elf file that is output by the compiler. This provides the memory locations to be read, and the developer can then set their sample rates and monitor how the variable(s) change over time. A simple example for a three-variable trace can be seen in Figure 4.
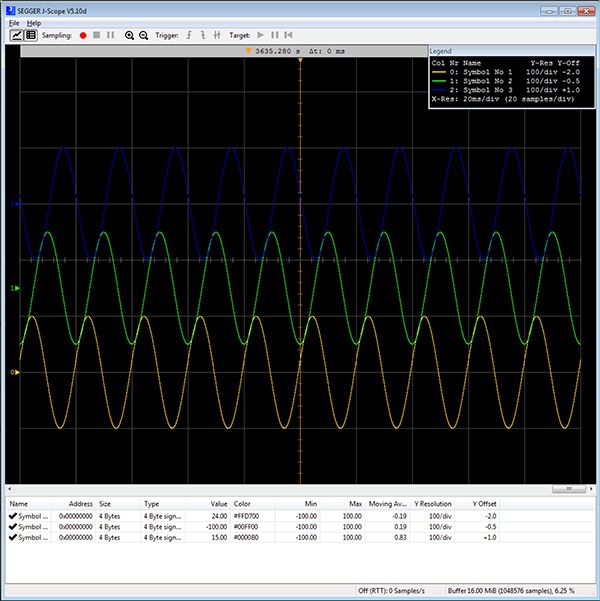 Figure 4: J-Scope can be used to monitor variables through the J-Link while an application runs in real-time. (Image source: SEGGER Microcontroller Systems)
Next up is Ozone. Ozone is a debugger interface and performance analyzer. Developers can load their elf file into the tool and perform source-level debugging. They can set breakpoints and update their code. An especially useful feature for developers is that they can also perform instruction tracing (if their hardware supports it) and identify what assembly and C code statements have been executed. This is particularly useful for verifying code coverage of hardware-in-loop (HiL) testing.
Ozone also can help developers analyze their system performance (Figure 5) and visualize variables over time. This provides capabilities like J-Scope but in a more integrated manner. It can even be used to monitor power consumption and synchronize all these events together in one place.
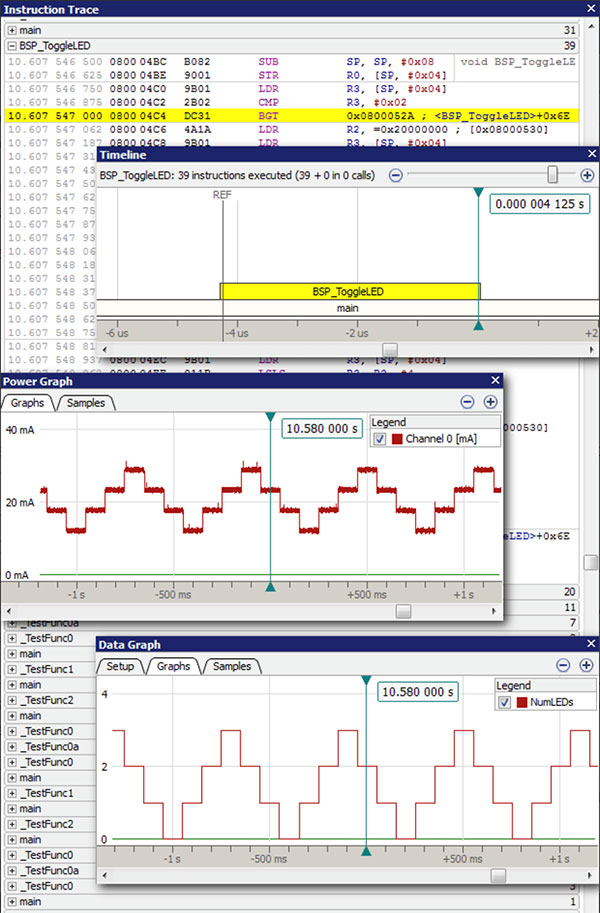 Figure 5: Ozone can be used to trace variables through the J-Link while an application runs in real-time in addition to code coverage and RTOS aware debugging. (Image source: SEGGER Microcontroller Systems)
A third tool is SystemView. SystemView allows developers to analyze their RTOS system runtime behavior. Task switching is recorded in a trace buffer and then reported to SystemView through the debugger (Figure 5). SystemView then displays this information in a way that allows a developer to see their context switches and measure their system’s performance. This is also a great way to visualize a system and find bugs and other issues.
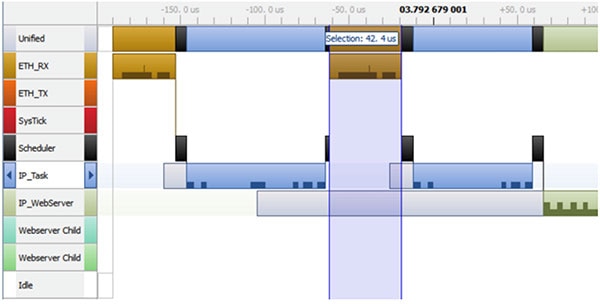 Figure 6: SystemView provides a link into an RTOS that allows developers to measure task performance and visualize what the RTOS is doing and when it’s doing it. (Image source: SEGGER Microcontroller Systems)
Tips and tricks for debugging an embedded system
Debugging an IoT device requires that developers have both the right tools from a hardware and a software perspective. Both pieces need to be in place if developers are going to minimize the time that they spend debugging. To successfully debug, there are several “tips and tricks” developers should keep in mind such as:
- Use a professional debugger that maximizes interface baud rate. The amount of useful data that can be obtained from a system will depend on how quickly that data can be received. Slower speeds result in a longer debug session.
- Setup the debug software early in the development cycle. Developers shouldn’t wait until they have a problem to setup their debugging tools.
- Use trace tools from the start of development. This will allow developers to monitor their system performance and immediately understand how software changes affect it.
- Leverage instruction tracing or program counter sampling to understand system code coverage during testing. Bugs will exist in untested conditional branches and code.
- Leverage fast transfer protocols to get data off-chip such as the Real-time Transfer (RTT) libraries.
Developers that follow these “tips and tricks” will find that they save quite a bit of time and grief when attempting to develop an IoT device.
Conclusion
IoT device software has become complex, but that does not mean that professional or hobbyist developers need to get stuck constantly debugging their systems. Using professional development tools and software can provide developers with the insights they need to not just debug a system, but to analyze and improve their systems performance. By making the investment in these tools, users can dramatically decrease the time spent debugging, and get their projects working and to market in a reasonable time frame.

Disclaimer: The opinions, beliefs, and viewpoints expressed by the various authors and/or forum participants on this website do not necessarily reflect the opinions, beliefs, and viewpoints of DigiKey or official policies of DigiKey.


