In Defense of printf Debugging
2025-06-02 | By Nathan Jones
Does this look familiar to you?
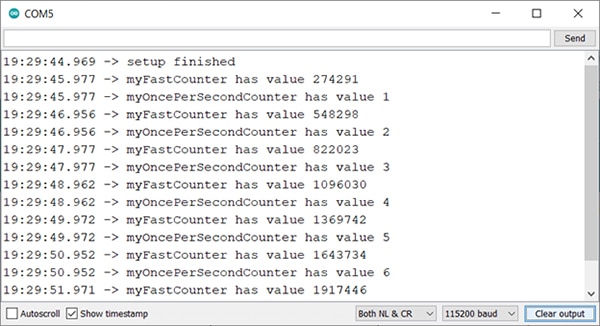
StefanL38. (2022, April 7). Sample Serial Monitor Output. Arduino Forum. https://europe1.discourse-cdn.com/arduino/original/4X/1/2/4/1249612df0255785869005388373c1609b9eb173.png
Ah, the infamous printf debugging! (Or perhaps you know it better as Serial.println debugging.) Used around the world by developers who want to know the answers to simple questions like “Does my program ever reach this point?” or “What’s the value of this loop variable?” Despite its ubiquity and ease of use, though, for years I used to decry printf debugging, asserting over and over again how it paled in comparison to single-step debugging. Single-step debugging is what you can do when you have a debug adapter like a J-Link (for ARM devices and a few others), ST-Link (for STM32s), or an MPLAB SNAP (for PICs/AVRs). Those debug adapters (and others like them) give you full control over a microcontroller: the clock signal, the values stored in memory, everything.
Figuring out if a program ever reaches a specific point in the code is as easy as setting a breakpoint there and running the program; the debug adapter will configure the microcontroller to literally stop executing code if the breakpoint is ever reached.
Determining the value of a loop variable is as easy as setting a breakpoint inside or just after the loop and then inspecting the memory location where the loop variable lives. Heck, you could even change the value of the loop variable while the loop is running by setting a breakpoint inside the loop and changing its value in memory to whatever you wanted!
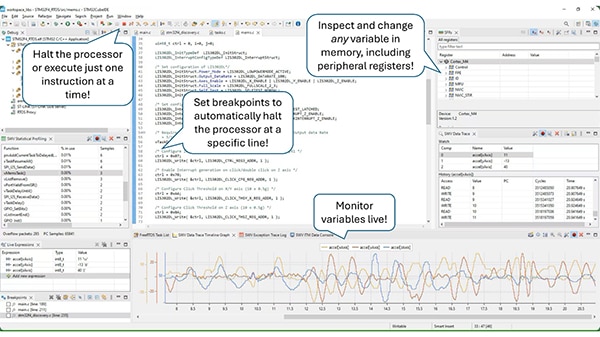
Sample debugging session inside STM32CubeIDE (annotations added by the author). (n.d.). ST Microelectronics. https://www.st.com/content/dam/st-crew/developer-zone/cube-ide/stm32cubeide-debug%201%403x.png
How could seeing Here or i = 1 in the terminal/Serial Monitor ever hold a candle to something like that??
But this isn’t an article about how awesome single-step debugging is (seriously, it’s awesome). Recently, I began researching why and how a developer might set up a logging system on a microcontroller, and lo and behold, I finally understood the importance of using printf! Logging (whether to the terminal or a file) solves a different set of problems than single-step debugging, and for some problems, it's actually the better tool! In this article, we’ll discuss which types of problems are best solved with logging/printf and why using both printf and single-step debugging could help you find bugs even faster than using either technique alone.
To begin, let’s revisit the problem of figuring out if a program ever reaches a specific point in the code. I’ve already mentioned that this is probably best solved with a debug adapter and a breakpoint, but what about a related problem? What if, instead, we wanted to know the sequence of function calls that were being made by our program? For example:
- “Does process() run before read()?”
- “How many times does update() run for every one time that send() does?”
Here's how we might find that out with a debug adapter and single-step debugging:
- Set breakpoints at the start of read(), process(), update(), and send()
- Run the program until a breakpoint is reached
- Record which breakpoint was reached
- Repeat steps 1-3, like, a gazillion times
A software developer who made the mistake of trying to follow the procedure just described.
That sounds awful and tedious! I write software to save time, not to create more manual work for myself!
How would we solve this problem using printf debugging?
- Add printf (“Inside read”) to the top of read() (ditto for process(), update(), and send())
- Run the program
- Visually inspect the output (or use another program to analyze a text file of the output from printf/Serial.println)
Here’s what that might look like:
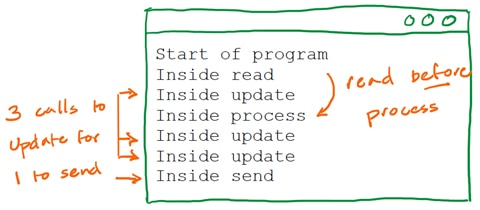
Wow, that was so much easier! We can immediately see that process() does not run before read() and it looks like update() runs about three times for each time that send() is run.
In fact, we can do even better! Take a look at the example output below, where I’ve added a timestamp (in the format “ss.ssss”) of when each message was sent/received and a count variable for each time one of those functions was called.
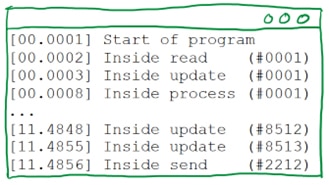
Just these two little additions gives us a lot of useful information. For instance, now we know:
- Not only does process() happen after read(), it happens 600 µs after read().
- It looks like update() is actually called 3.8 times more often than send() is called (
 =3.84); update() is called every 1.3 ms on average (
 =1.3) while it looks like send() is only called every 5.2 ms on average (
 =5.2).
Furthermore, if we had included messages at the end of each function (to indicate when those functions were returning) then we could even glean information about things like function call trees and execution times.
We could summarize this example by saying that single-step debugging is better suited for instruction tracing while printf debugging is better for function tracing. And, in general, this is exactly the difference between these two styles of debugging: single-step debugging is very “micro” while printf debugging is more “macro”. Single-step debugging is incredibly powerful, but it’s like looking at your system through a microscope. On the other hand, printf debugging (despite it being less powerful than single-step debugging in many ways) provides you with a much better overall picture of what’s going on in your system. In addition to function tracing, for instance, printf debugging is better for things like:
- Determining the maximum/average size of the stack, the heap, a queue, a linked list, etc.
- Identifying problematic system behaviors that could result in errors later on (e.g., input values out of range, invalid addresses, numeric overflow/underflow, etc.)
- Recording detailed error information when an error does occur
- Recording changes in device mode (such as from “user-mode” to “developer-mode” or from “home screen” to “system setup”)
- Recording user interactions/network transactions
- Watching live data values, such as from ADC readings (using printf in conjunction with programs such as STM32CubeMonitor or Serial Studio)
- Finding “Heisenbugs”
- Debugging a system when halting the processor with a single-step debugger may have adverse effects (such as for a system running a multi-threaded program or controlling a motor)
- And many more
In each of these cases, gaining this information from a log file would be much more straightforward than trying to do so by setting breakpoints and then inspecting memory using single-step debugging. Personally, I’m starting to think that most developers (and the programs they’re writing) would benefit from having many more print statements than they currently have!

Best used liberally
“So, if both styles of debugging are useful in their own ways, wouldn’t it be best if we used them together?” I’m so glad you asked! Because I think the answer is a resounding YES. Consider the following example: let’s say your microcontroller has been unexpectedly resetting itself of late and you want to figure out why. Let’s take a look at a sample log file for that system, in which messages can be one of three types: [I]nfo, [W]arning, or [E]rror. (The log messages will also show the file, line number, and function where each message was generated.)
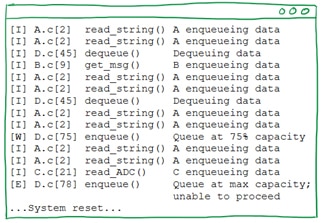
Okay, so the device seems to be running out of space in a queue (i.e., running out of memory) and then resetting itself. Furthermore, we can see from the logs two important things:
- Modules A, B, and C all put items in the queue, and (most importantly)
- Module A seems to be using the queue way more than the other two modules
Even though module C was the last to put an item in the queue, it’s probably not the problematic module here! Maybe we just need a bigger queue, but maybe we should also inspect module A to determine why it’s using the queue so much more than the other modules. Had we used single-step debugging to work our way backward from the system reset, we may have mistakenly suspected module C as being the culprit instead of module A! Instead, we can start our single-step debugging in module A, where it’s more likely to yield good results.

Better together
Far from being demonstrably inferior to single-step debugging, then, printf debugging serves many useful purposes and it can vastly shorten debugging sessions when used in conjunction with single-step debugging. The log files generated using printf can help you see, at a “macro” scale, what your system is doing and can alert you to problematic areas before they become full-blown errors.
If you’ve made it this far, thanks for reading, and happy hacking!


 =3.84); update() is called
  =1.3) while it looks like send() is only called
  =5.2).