Arduino 2.1 IDE Overview
2023-08-21 | By Don Wilcher

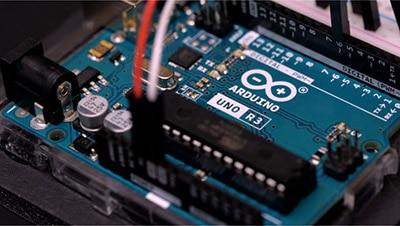
Since its introduction in 2005, the Arduino platform has continued to transform maker culture. Arduino has become one of the most successful microcontroller and open-source electronics hardware platforms, allowing makers to easily create a variety of electronics, robotics, and home automation projects. One of Arduino’s key successes lies in its ease of developing software. The Arduino Integrated Development Environment (IDE) has evolved, allowing you to easily code clever and sophisticated devices.
 Arduino IDE: Alpha product
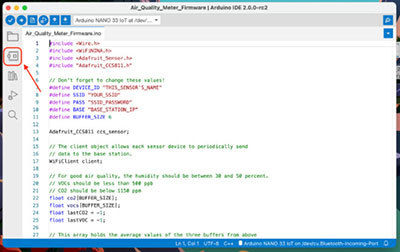
The latest version of the Arduino IDE, version 2.1, has various features allowing the installation of accessible libraries, code development, and debugging. Providing support and ease in developing projects, the Arduino 2.1 IDE allows data visualization and auto-completion, while supporting a live debugger and navigation of code.
Installation of the Arduino 2.1 IDE
You can easily obtain the Arduino 2.1 IDE from the website here. As there are nightly builds of the software, the latest features can be obtained easily. The Arduino 2.1 IDE can be installed on Windows, Linux, and macOS operating systems — Chromebooks are also supported and can be installed with the Arduino 2.1 IDE software.
 The Arduino 2.1 IDE download panel
The New Arduino 2.1 IDE Look
With the software installed, the Arduino 2.1 IDE’s appearance looks more professional than the early Alpha and previous builds. The IDE User-Interface (UI) is clean and easy to navigate, with supporting tools like the sketchbook, board manager, library, debugger, and search on the left side of the window.
 Location of the Supporting Tools
Supporting Tools
The Arduino 2.1 IDE provides developmental and code troubleshooting tools to aid you in creating electronics, robotics, and automation projects with ease. The supporting tools listed below can help you fix software bugs and expand the hardware capabilities of the Arduino.
- Sketchbook – The sketchbook provides examples of Arduino code that can be incorporated into your electronics project.
- Board manager – Software code packages created by third parties and the Arduino company that allow microcontroller boards to work with the Arduino ecosystem.
- The Library Manager – Software code extensions that allow third-party hardware to work with the Arduino family of embedded development boards.
- Debugger – Specialized tools for the editor to identify software code errors.
- Search – Keyword text may be located with this tool.
 Supporting Tools
Library Support
The Arduino 2.1 IDE has extensive library support. This extensive library support is bundled with a large collection of third-party libraries, which provide pre-written code for various sensors, actuators, electronic displays, communication protocols, and more. Using this library support, you can add complex functions and features to your projects without writing extensive code from scratch. As a result, the library support saves time and effort in developing your Arduino project and can help someone with little programming experience easily create awesome and functional electronic projects.
The extensive library support also allows users to manage and update libraries using the Library Manager. The Library Manager is a centralized location where libraries can be easily searched, installed, and updated. This supportive function allows users to access and update specialized code features and bug fixes. This ecosystem is supported by a collaborative contributor community consisting of hardware developers, software developers, and dedicated Arduino makers.
 Accessing the Library Manager
Another key feature of the Library Manager is its continuous and automatic updates, which occur whenever the IDE is launched.
 Updates made to the Library Manager
Software Debugging Tool
In addition to the Library Manager, the Arduino 2.1 IDE possesses a range of debugging tools that can assist you in finding and correcting software errors within an Arduino project. The Serial Monitor allows you to identify software bugs using variables. More specifically, you can identify errors using the Serial Monitor by adding debug statements associated with software code variables. Such areas can be tracked and identified using the variables displayed in the Serial Monitor, and key variables will be displayed during the runtime of the executed Arduino code. Using the Serial Monitor, you can identify software code errors, track variable values, and check the logic flow within the sketch.
 Checking task3Time variable using the Serial Monitor
Hardware Debugger Tools
Hardware debugger tools allow you to investigate the internal registers of the microcontroller using test code. With a hardware debugger tool attached to a SAMD-based microcontroller board such as the Arduino MKR 1010, you can investigate breakpoints, step through code, and perform a variable inspection. Attaching a hardware debugger like an Atmel In-Circuit Emulator (ICE) to an MKR 1010 SAMD microcontroller board, you can debug complex projects using the new Arduino 2.1 debugger. Note that an in-circuit emulator is a hardware device used to debug an embedded system’s software. The ICE uses a processor capable of supporting software debugging operations and carrying out the system’s main functions.
 Accessing the Arduino 2.1 IDE debugger
The new Arduino 2.1 IDE provides you with a set of accessible and enhanced code development tools. Bundling the simplified code programming environment, extensive library support, and software and hardware debugging tools, the Arduino 2.1 IDE allows you to create and debug your microcontroller projects easily. Such enhancements, along with color-coded text and autocomplete, have changed the microcontroller project space, with many makers utilizing this new and innovative IDE development platform.