How to Make Fast and Easy Frequency-Response Measurements With an Oscilloscope
Need to check the frequency response of a filter; or measure the bandwidth of an amplifier? There’s no need to drag over a frequency response or network analyzer. You can make that measurement with an oscilloscope and a square wave with a fast edge.
Frequency response measurements require an input with a constant amplitude over the frequency range of the measurement. The three types of signals with a flat frequency spectrum are swept sine, impulse, and broadband noise. Of the three, the impulse response yields the fastest result. So the next question is, how do you get an impulse waveform?
Remember circuit analysis 101; the impulse is the derivative of the step function. If you have the step response of the device you’re testing, you can convert it into the impulse response by differentiating it. Most benchtop oscilloscopes include integration and differentiation as part of their math function packages. In this example, the Teledyne LeCroy HDO 4054A 500 megahertz (MHz) oscilloscope is used. The oscilloscope’s bandwidth must exceed that of the device being measured by a factor of five to keep systematic amplitude errors below a half of a decibel (dB). An alternative oscilloscope is the Teledyne LeCroy WAVESURFER-3054Z.
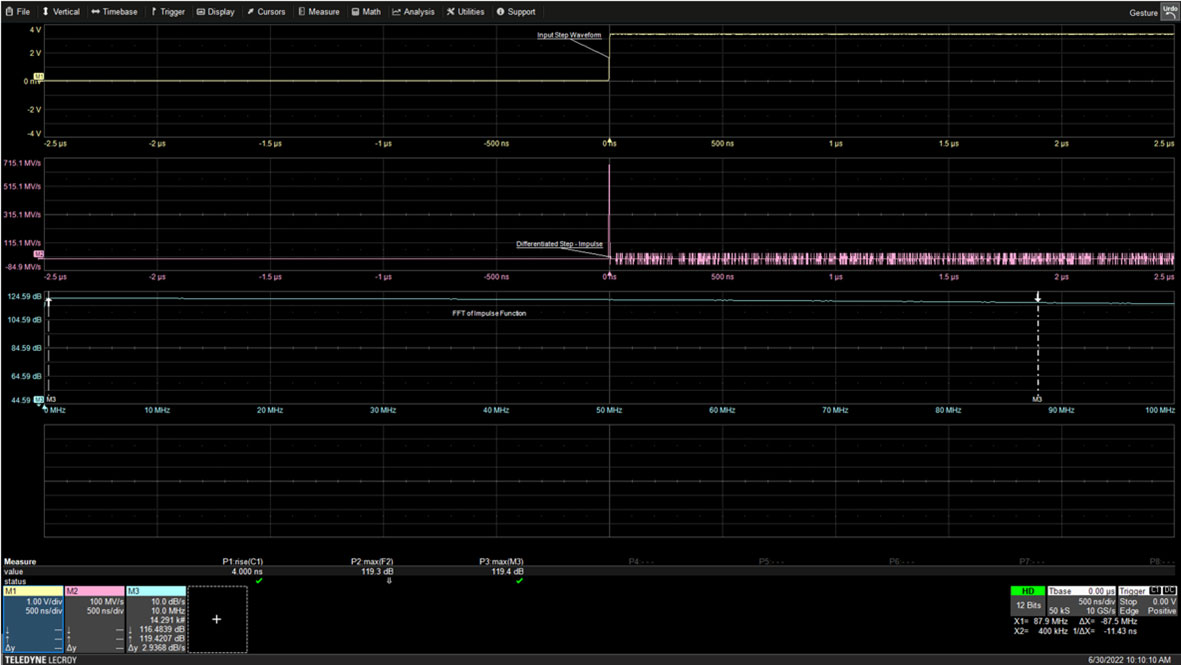
How do you get a step function? That’s easy; the isolated rising or falling edge of a square wave or pulse is a step function: differentiating the step function yields an impulse. This is shown in Figure 1 for the rising edge of a 10 kilohertz (kHz) square wave (upper trace).
 Figure 1: The rising edge of a 10 kHz square wave becomes an impulse function when differentiated. The spectrum of the impulse is flat with a bandwidth that is inversely proportional to the rise time of the square wave. (Image source: Art Pini)
The oscilloscope captures only 5 microseconds (ms) about the edge. The balance of the 100 ms square wave is off the screen. The step function is differentiated using the oscilloscope’s math capability and displayed as the center trace. The fast Fourier transform (FFT) of the impulse is shown in the bottom trace. The bandwidth of the impulse is determined by the rise time of the square wave. In this case, the rise time is measured as 4 nanoseconds (ns), as shown in measurement parameter P1 beneath the trace grids. The bandwidth of the impulse can be calculated as 0.35 divided by the rise time for an oscilloscope with a single-pole amplitude response.
The result in this instance is 87.5 MHz, which is marked by the right-hand cursor on the FFT display with a numerical reading within the math trace M3 annotation box. The amplitude of the FFT at 87.5 MHz is 116.48 dB compared to the maximum FFT amplitude of 119.43 dB, or about -3 dB from the maximum, thereby confirming the signal bandwidth.
The signal source for the frequency response measurement should offer square waves or pulse waveforms that are fast enough to provide adequate measurement bandwidth. The 4 ns edge used in the figure was generated by a Teledyne LeCroy T3AWG2152-D 150 MHz arbitrary waveform generator. A signal source with an even greater rise time of 2 ns is the Teledyne LeCroy T3AFG200, a 200 MHz, 2.4 Giga sample per second (Gsample/s) arbitrary function generator. The 2 ns rise time provides a signal bandwidth of 175 MHz.
Frequency response of a digital low-pass filter
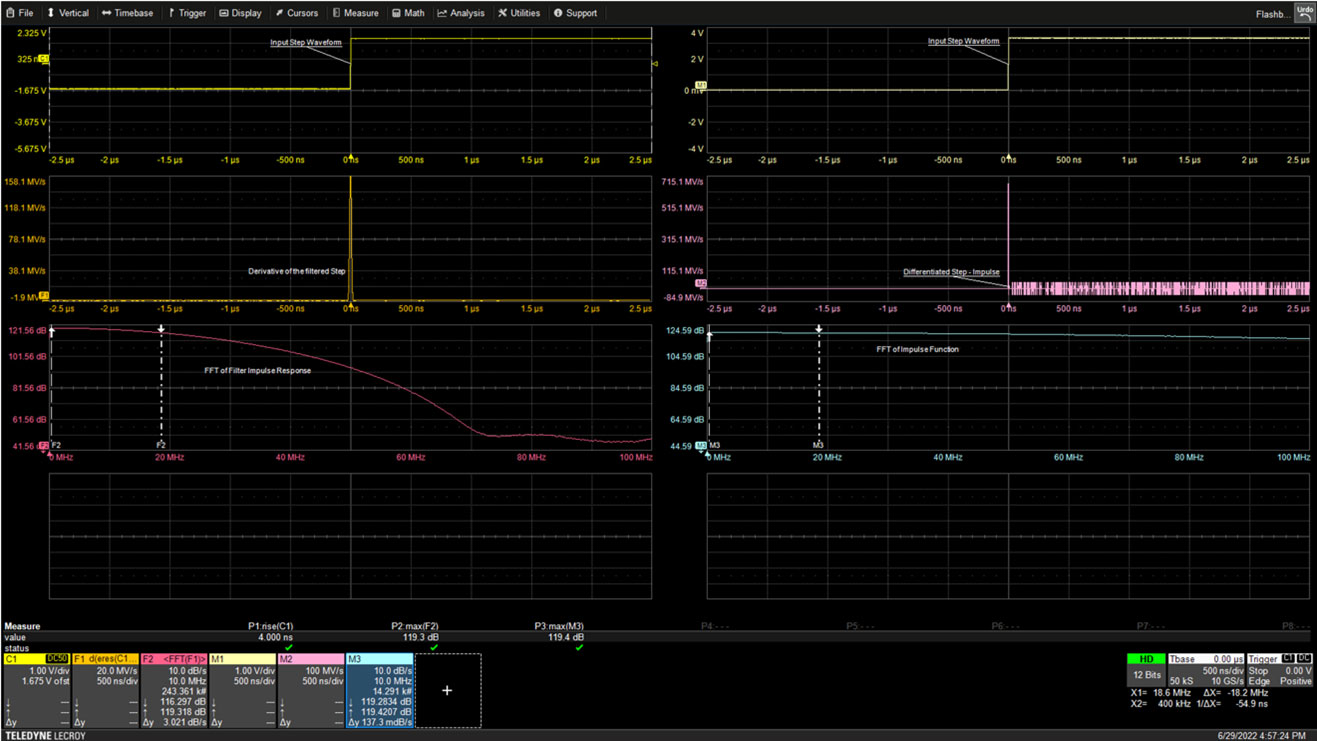
The following example measures the frequency response of a digital low-pass filter using the Teledyne LeCroy HDO4054A oscilloscope and the T3AWG2152-D (Figure 2). These filter measurements appear in the left-hand column of traces.
The step signal is applied to the filter input. The filter output is differentiated and displayed. Note that the filter has broadened the impulse response due to its limited bandwidth. The filter output is applied to the FFT and averaged to produce the magnitude frequency response of the filter.
 Figure 2: The step signal, the top left trace, is applied to the filter input. The filter output is differentiated and displayed in the center left trace. The FFT of the filtered signal, bottom left trace, shows the frequency response of the filter. (Image source: Art Pini)
Cursors on the FFT of the filter output read the -3 dB bandwidth in the F2 annotation box at a frequency of 18.6 MHz: this is the filter bandwidth. At the same time, the cursor on the FFT of the impulse function in the bottom right trace shows an attenuation of only 0.12 dB in the M3 annotation box at 18.6 MHz, indicating that the signal source is basically flat.
Conclusion
As shown, the response of frequency-dependent components can be measured quickly and easily—without resorting to network or frequency response analyzers—using basic oscilloscope functions operating on a square wave with a fast edge.

Have questions or comments? Continue the conversation on TechForum, DigiKey's online community and technical resource.
Visit TechForum


