Make Optical Liquid Analysis Ubiquitous Using a Multimodal Sensor Front-End
Contributed By DigiKey's North American Editors
2023-07-26
Within the context of the global concern over potable water security due to droughts, storm intensity and frequency, and the growing population, liquid analysis has become critically important. Real-time and on-site analysis of water samples is required to minimize pollution and its impact on the ecosystem.
This real-time sensing of liquids requires advances in instrumentation that include smaller size, lower power consumption, improved accuracy, rapid customization, faster response times, and robustness, all while delivering high-quality results.
Optically-based instrumentation is useful here as it can make high-precision measurements that are non-destructive, providing non-contact sensing of measurements such as turbidity, total organic carbon, total suspended solids, dissolved oxygen, and the presence of ionic contaminants. However, such systems require complex analog front-ends (AFEs) to drive light emitting diodes (LEDs) while sensing and digitizing the received light in the face of both ambient and system noise. Such design capabilities are beyond the typical designer’s skillset. What’s needed is a more elegant, off-the-shelf solution.
This article briefly discusses optical liquid analysis before introducing a portable, real-time platform for rapid liquid analysis based on a multimodal optical sensor AFE from Analog Devices, Inc. A reference design based on the AFE that offers up to four modular optical path bays is also introduced. The reference design is used to demonstrate how to take measurements of potential hydrogen (pH), turbidity, and fluorescence, and create calibration curves and measure unknowns.
Optical liquid analysis basics
Optical liquid analysis can be used to measure the concentrations of elements in a liquid sample. The technique has many advantages, including that it is non-destructive and uses non-contact sensing. In addition, the results offer high precision and low drift.
Conceptually, optical analysis exposes the liquid sample to light from a source such as a light emitting diode (LED) with a known optical wavelength. The light passes through the sample, interacts with it, and is detected by a photodiode (PD). The measured response from the PD is plotted against the responses from samples with known concentrations, which form a calibration curve against which the unknown value can be established.
This process describes the analytical measurements that would be employed in a general laboratory where precision optical liquid measurements combine the results of mixed domains of electronics, optics, and chemistry. Making this type of testing ubiquitously available requires scaling the processes down to a small form factor, thereby increasing the intricacy of the design.
A modular solution for rapid liquid measurement
To simplify the instrument design process, Analog Devices created the EVAL-CN0503-ARDZ reference design based on the ADPD4101BCBZR7 analog optical front-end (AFE). The ADPD4101BCBZR7 is a complete multimodal sensor front-end that can drive up to eight LEDs and measure up to eight separate returned current inputs (Figure 1). The AFE rejects signal offsets and interference from asynchronous modulated interference, which is usually from ambient light. The AFE is highly configurable and features an optical signal-to-noise ratio (SNR) of up to 100 decibels (dB) with high ambient light rejection using on-chip synchronous detection methods, allowing it, in many cases, to be used without an optically dark enclosure.
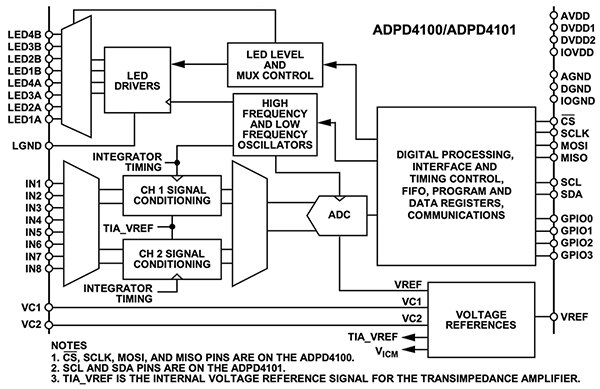 Figure 1: The ADPD4101BCBZR7 multimodal sensor AFE can drive up to eight LEDs and measure up to eight separate returned current inputs. (Image source: Analog Devices, Inc.)
The EVAL-CN0503-ARDZ reference design enables rapid prototyping of liquid analysis measurements, including fluorescence, turbidity, absorbance, and colorimetry (Figure 2). It has four modular optical test bays that provide pass-through optical paths, and two bays include orthogonal (90°) scattering paths. A 3D-printed cuvette holder for standard 10-millimeter (mm) cuvettes is included, which can be placed in any of the four optical paths. The reference design also provides measurement firmware and application software targeted for liquid analysis.
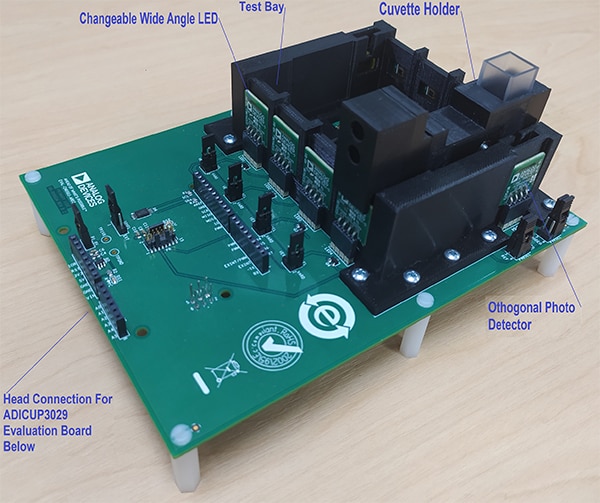 Figure 2: The EVAL-CN0503-ARDZ includes a 3D-printed cuvette holder for standard 10 mm cuvettes that can be placed in any of the four optical paths that incorporate the measurement optics. (Image source: Analog Devices, Inc.)
The EVAL-CN0503-ARDZ connects with the EVAL-ADICUP3029, a 32-bit Arm® Cortex®-M3 microcontroller board, which handles the measurement operation and data flow. The EVAL-ADICUP3029 board connects directly to a laptop to display acquired data in the evaluation graphic user interface.
Liquid analysis measurements of fluorescence, turbidity, absorbance, and colorimetry of a sample can be measured by the EVAL-CN0503-ARDZ. The cuvette holder houses the optics, including a collimating lens and beam splitter. Each of the slots holds a reference photodiode and provides an appropriate optical path for plug-and-play measurement. In addition, the LED and photodiode cards in each bay can be switched out for further customization.
As a demonstration, measurements of pH, turbidity, and fluorescence will be used to create calibration curves, and then measure unknowns with the EVAL-CN0503-ARDZ and its evaluation software. Additionally, the noise level value and limit of detection (LOD) are calculated. This will determine the lowest concentration that can be detected by the EVAL-CN0503-ARDZ in each example.
Absorbance test example
Absorbance measurements, based on the Beer-Lambert Law, involve determining the concentration of a known solute in a liquid solution based on how much light is absorbed at a specific wavelength. This is a form of colorimetry. In this example, absorbance is used to measure pH, a common parameter in water quality testing. This type of test is also useful in analysis applications, including dissolved oxygen, biological oxygen demand, nitrates, ammonia, and chlorine.
Absorbance measurements, using a direct or pass-through optical path, can be made using any of the four optical paths on the EVAL-CN0503-ARDZ (Figure 3).
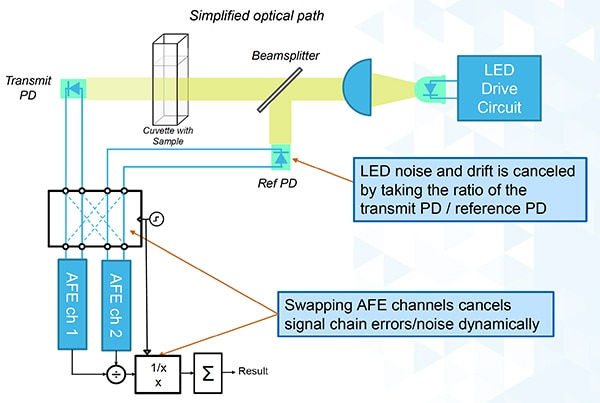 Figure 3: Shown is the optical setup for an absorbance measurement using the EVAL-CN0503-ARDZ. The cuvette holder in the EVAL-CN0503-ARDZ houses the optics, including a collimating lens and beam splitter. (Image source: Analog Devices, Inc.)
An LED at the desired wavelength generates the incident beam. A beam splitter in the optical path directs some of the light to a reference photodiode that samples the beam intensity. The balance of the optical beam is directed through the sample. Variations in light intensity and noise of the LED source are canceled by taking the ratio of the outputs of the transmit and reference photodiodes.
Ambient light contamination from constant light sources is rejected by as much as 60 dB by the ADPD4101BCBZR7. This is done using a synchronous modulation scheme that modulates the LED current and synchronously measures the difference between the dark (off) state (where the ambient light is the only component) and the excited (on) state (where both ambient light and the LED component are present). This ambient light rejection is automatic; no external controls are required.
In addition to the EVAL-CN0503-ARDZ, this example requires the EVAL-ADICUP3029 mentioned earlier. It uses an API pH test and adjustor kit and a set of pH buffer solution samples for calibration.
The analytes were prepared by adding a color indicator (bromothymol blue) from the API test kit to the prepared solutions with different pH values. Bromothymol blue, in solution, separates into a weak acid with high absorbance of light at 430 nanometers (nm), and a conjugate base which has high absorbance of 650 nm light.
The solutions were transferred into cuvettes, and the pH measurement was made at these two different wavelengths where the indicator shows changes in absorption as a function of pH. This is easily accomplished in the EVAL-CN0503-ARDZ using two LED cards for different wavelengths, which were inserted into optical path 2 and optical path 3. The cuvette holder is moved into the two different paths for the measurements.
The results from both optical paths were exported into Excel using the EVAL-CN0503-ARDZ evaluation software graphic user interface (Figure 4).
 Figure 4: Shown are the absorbance calibration curves of pH for tests with 430 nm (left) and 650 nm light sources (right). (Image source: Analog Devices, Inc.)
In both cases, the pH vs. absorbance was plotted to create the calibration curve. A trendline function in Excel was used to generate an equation for the curve. The goodness of fit estimate, R2, is close to 1.0 in both instances, indicating the excellent quality of the fit. The concentrations of unknown samples can be determined from these equations with the sensor output entered as the x variable, and the resulting y value is the pH. The EVAL-CN0503-ARDZ evaluation software implements two fifth-order polynomials, INS1 and INS2. Once the polynomials are stored, the INS1 or INS2 mode can be selected so that measurement results are reported directly in the desired unit, in this case, pH. This simplifies getting a result for an unknown sample.
The noise level of the measurement requires two different data points for each wavelength. One should be a lower pH value and the other should be a higher one. Two values are used because the curve fit is not linear. The pH values chosen were 6.1 and 7.5. Multiple measurements were made of each point, and the standard deviation of the data yields the root mean square (RMS) noise value at each wavelength for each pH value. The results are shown in Table 1.
|
|||||||||||||||
Table 1: Shown are the RMS noise values for two pH values at two wavelengths. (Table source: Analog Devices, Inc.)
Note that this data excludes variations due to sample preparation.
The limit of detection (LOD) determines the lowest concentration likely to be detected by the EVAL-CN0503-ARDZ. The LOD is typically determined by measuring noise at low concentration levels. To achieve a confidence level of 99.7%, the noise value is multiplied by three. Given that pH is a logarithmic scale, the LOD was determined for a pH of 7. This was again done at wavelengths of 430 nm and 625 nm. The LOD at 430 nm was a pH of 0.001099, and the LOD at 615 nm was a pH of 0.001456.
A turbidity test example
Turbidity measures the relative clarity of a liquid. The measurement is based on the light-scattering property of particles suspended in the liquid. Light scattering is affected by the size and concentration of the suspended particles, as well as the wavelength of incident light. These factors affect the amount of light scattered and the scattering angle. Turbidity testing is conducted in many industries, including water quality and life sciences. It can also be applied to determining algae growth by measuring optical density.
The optical path for turbidity testing uses photodiodes placed to detect light at angles of 90˚ or 180˚. In the EVAL-CN0503-ARDZ, turbidity testing requires a detector at 90˚, which is available in test bays 1 and 4. Optical bay 4, with a 530 nm LED board inserted as a source, is shown in Figure 5.
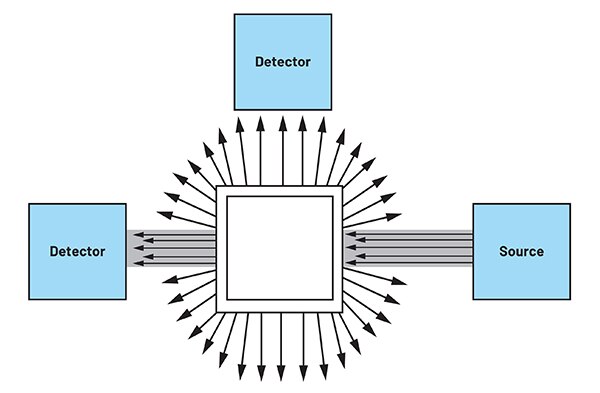 Figure 5: The optical path for a turbidity test uses photodetectors at 90˚ and 180˚ from the light path to detect light scattered by particles in the solution. (Image source: Analog Devices, Inc.)
This example demonstrates a modified version of EPA Method 180.1, ‘Determination of turbidity by Nephelometry’, calibrated and reported in nephelometric turbidity units (NTU).
The equipment used for turbidity testing includes the EVAL-CN0503-ARDZ and the EVAL-ADICUP3029 evaluation boards, as well as the Hanna Instruments turbidity standard calibration set. The turbidity calibration standard provides microbeads of specific sizes in ultrapure water. These solutions are used to calibrate and validate turbidity measurements.
Using the EVAL-CN0503-ARDZ software evaluation graphical user interface (GUI), measurement results were exported into Excel, where a turbidity calibration curve was generated (Figure 6).
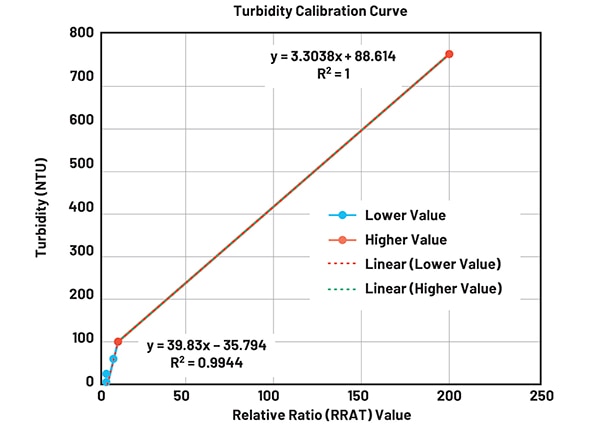 Figure 6: These calibration curves are based on the results of the turbidity tests. The linear curve fit shows that the linear models have excellent goodness of fit estimates (R2). (Image source: Analog Devices, Inc.)
Note that in Figure 6, the relative ratio (RRAT) values of the abscissa are referenced to the baseline or absolute ratio values based on a known measurement setup with an empty cuvette, or with distilled water where the ratio of incident to reflected light is nearly 1. This process is used to remove small factors introduced into the measurement by the optical glass elements, such as the beam splitter, lens, and filters. This value is used as a reference for successive measurements.
Because the 90° scattering measurement is less responsive to high turbidities, the response curve was split into two sections, the first section represents lower turbidity (0 NTU to 100 NTU), and the other represents higher turbidity (100 NTU to 750 NTU). Two linear fits were then made for each section. Even though there are now two equation values, the EVAL-CN0503-ARDZ can still be used to quickly show resulting NTU values using the built-in INS1 or INS2 polynomial fits.
The noise value was determined by taking the standard deviation of repeated measurements. Due to the linear fit, only one noise point near the bottom of the range (12 NTU) was used. The noise level was measured at 0.282474 NTU.
The LOD was established by taking the noise value of a sample with a low or blank concentration. Again, the noise value was multiplied by three to represent a 99.7% confidence interval. For a blank sample concentration, the LOD was 0.69204 NTU.
A fluorescence test example
Fluorescence is the result of electrons of some materials being excited by a beam of light, causing them to emit light at another wavelength. The emitted light intensity is proportional to the concentration of the light-sensitive material. Fluorometry is generally much more sensitive than using absorbance measurements to measure the concentration of materials in the solution. Fluorescence emissions can be used to identify the presence and quantity of specific molecules because they are chemically specific. Fluorescence measurements are linear over a wider range of concentrations. The applications of fluorescence measurements include biological assays, dissolved oxygen, chemical oxygen demand, and detecting successful pasteurization in milk.
Generally, fluorescence emissions are measured using a photodetector positioned at 90° from the incident light to minimize its effect on the measurement. A reference detector to measure the incident light is used to minimize factors that interfere with the measurement. These factors include distortions from the light source, external lighting, and slight movements in the sample. Additionally, an optical monochromatic or long-pass filter is used with the fluorescence detector to increase the separation of the incident and the emitted light (Figure 7).
 Figure 7: The optical path for fluorescence measurement. The fluorescence photodiode is placed at 90° to the incident light path. A fluorescence filter attenuates the source LED wavelength. (Image source: Analog Devices, Inc.)
Again, the equipment used for fluorescence testing includes the EVAL-CN0503-ARDZ and the EVAL-ADICUP3029 boards.
In this example, spinach leaves were used to demonstrate fluorescing chlorophyll. A spinach solution was created by blending spinach leaves with water. After filtering, this was used as a stock solution. Different percentages of spinach solution were created by diluting the stock solution and were used as standards to create a calibration curve. Since an orthogonal detector was needed, optical bay 1 in the EVAL-CN0503-ARDZ was used. The source was an LED with a 365 nm wavelength, with a long-pass filter inserted.
Seven different percentages of the spinach solution were tested, and the chlorophyll calibration curve was plotted (Figure 8).
 Figure 8: Calibration curve for percent spinach solution, including the trendline equation. (Image source: Analog Devices, Inc.)
As in the earlier examples, the trendline equation for the chlorophyll calibration curve can be stored so that the results are directly reported as a percentage by the EVAL-CN0503-ARDZ.
Because the calibration curve is non-linear, the noise was measured using two data points—7.5% and 20%. The standard deviation of multiple tests with each sample yielded an RMS noise value of 0.0616% spinach for the 7.5% sample, and 0.1159 % spinach for the 20% sample.
The LOD was determined using a blank or low-concentration sample. Again, the RMS noise measurement for the sample was multiplied by three to represent a 99.7% confidence level, producing an LOD of 0.1621% spinach.
Conclusion
The creation of a portable optical liquid analysis measurement system requires considerable knowledge of the interactions of chemistry, optics, and electronics to create a device that is precise, accurate, and easy to use. To design one with high accuracy and precision, designers can use the ADPD4101BCBZR7 optical AFE instead of designing a complex signal chain in-house. To help get started, the AFE is supported by the EVAL-CN0503-ARDZ reference design. This builds on the ADPD4101BCBZR7 by adding the optical components, firmware, and software to make an easy-to-use and highly adaptable prototyping platform, capable of producing accurate optical measurements of absorbance, colorimetry, turbidity, and fluorescence liquid parameters.

Disclaimer: The opinions, beliefs, and viewpoints expressed by the various authors and/or forum participants on this website do not necessarily reflect the opinions, beliefs, and viewpoints of DigiKey or official policies of DigiKey.


