Learn the Fundamentals of Signal Integrity
Contributed By DigiKey's North American Editors
2025-01-23
The rise of high-performance data centers to support artificial intelligence (AI) makes signal integrity (SI) critical so that massive amounts of data can be moved at ever higher rates. To ensure SI, designers must minimize reflections, noise, and crosstalk through attention to board layout and the use of appropriate conductors and connectors. They must also understand fundamental principles such as transmission lines, impedance, return loss, and resonance.
This article presents some of the terms used in the discussion of SI and what designers need to consider. It then introduces exemplary cable and connector solutions from Amphenol to show how they can ensure design success.
Transmission lines
A transmission line consists of two (or sometimes three) conductors with non-zero length separated by a dielectric (Figure 1). Conductors carry electrical signals between circuit elements with minimal loss or distortion. Common conductors are metals such as copper, which have high electrical conductivity, excellent transmission, and low power losses at a relatively low cost. Gold is an excellent conductor, but due to its high cost, its use is restricted to applications requiring high corrosion resistance, like connector pins and sockets. Other metals and alloys have been developed for specific applications or material characteristics.
 Figure 1: Transmission lines consist of conductors separated by a dielectric. The conductors can be parallel or concentric. (Image source: Amphenol)
Dielectrics are nonconducting materials that separate conductors by insulating the area around their conducting geometries. The properties of the dielectrics impact how signals travel over the adjacent conductors.
The dielectric constant (Dk) and dissipation factor (Df) are significant characteristics of dielectrics that impact transmission lines. The Dk determines the signal propagation speed on the line. For example, a material with a lower Dk has a higher propagation velocity. The Df represents the energy loss within the material as the signal travels down the transmission line. A lower Df indicates less signal attenuation, especially at high frequencies.
Common dielectrics are air and various plastics. A typical printed circuit board (pc board) substrate is a dielectric called flame retardant 4 (FR-4), a composite of woven fiberglass cloth impregnated with flame-retardant epoxy resin.
Standard transmission line configurations are coaxial cable, twisted pair, pc board stripline, and pc board microstrip. The two conductors are identified as the signal and return paths. The voltage on a transmission line is measured between the conductors along the line, and the current is measured through either of the conductors.
In SI, a transmission line is a distributed electrical component that carries transverse electromagnetic (TEM) or quasi-TEM waves between two conductors. These waves contain alternating electric (E) and magnetic (H) fields that are perpendicular to the wave’s direction of travel (Figure 2).
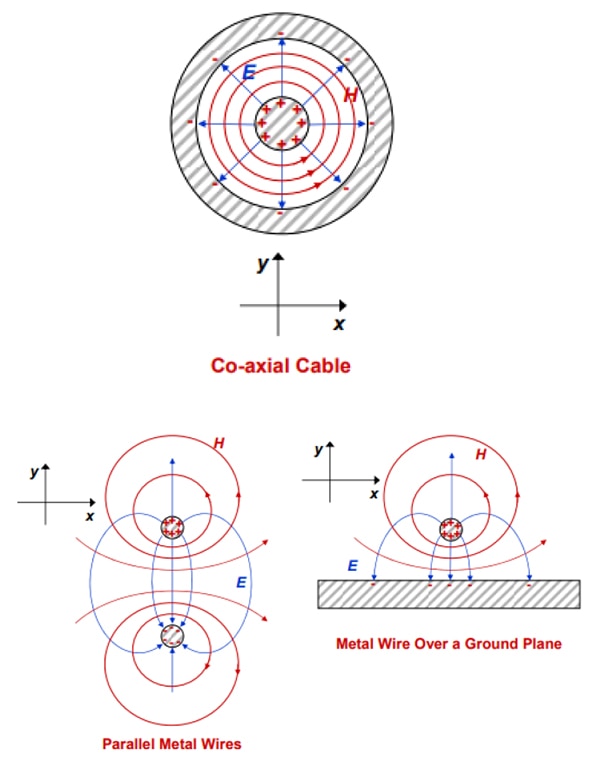 Figure 2: Transmission lines propagate energy along the line using alternating orthogonal electric and magnetic fields. (Image source: Amphenol)
A changing electric field creates a changing magnetic field as an alternating series of transformations, propagating the TEM wave along the transmission line in a direction perpendicular to both fields.
Transmission line connections between circuit elements are configured as single-ended or differential connections (Figure 3).
 Figure 3: Transmission lines can be configured as either single-ended (unbalanced) using a signal and a return or ground conductor, or as differential (balanced) with two complementary signal conductors and a ground conductor. (Image source: Amphenol)
A single-ended configuration uses a signal line and a ground line. The signals are not identical, and the configuration is considered an unbalanced propagation mode. A differential configuration uses two complementary signal lines and a ground line, generally run separately. Differential signals are an example of a balanced propagation mode because the signal of interest is the mathematical difference between the two signal elements.
Transmission line impedance
Electrical impedance is a circuit's opposition to a current due to an applied alternating voltage, measured in ohms (Ω). Impedance is the complex ratio of the voltage to the current at each point along the conductor.
Transmission lines must control their impedance to carry high-speed/high-bandwidth signals without degradation due to reflections. Their instantaneous impedance at each point in the line is constant and referred to as the characteristic impedance. Trace width, spacing, length, and dielectric properties between the traces and the ground plane control the transmission line’s impedance.
The characteristic impedance can be thought of as the resistance to energy transfer associated with wave propagation in a line much longer than the wavelength of the propagating signal.
Signal reflections
If a signal is propagated through a transmission line to a load with an impedance equal to the line’s characteristic impedance, the signal is fully delivered to the load. If the load impedance differs from the line’s characteristic impedance, then some of the energy incident on the load is reflected back toward the source.
The ratio of the amplitude of the reflected voltage, VR, to the amplitude of the incident voltage, VI, is the reflection coefficient (Figure 4). It depends on the load impedance (ZL) and the transmission line’s characteristic impedance (ZC).
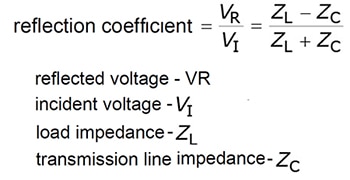 Figure 4: The reflection coefficient depends on the load and the transmission line's characteristic impedance. (Image source: Amphenol)
Reflections result from a signal transitioning across a boundary where the media have unmatched impedances (Figure 5). At each interface, the reflection coefficient determines the amplitude and phase of the reflection. The signal at the receiver is the sum of the transmitted signal and the time-delayed reflections.
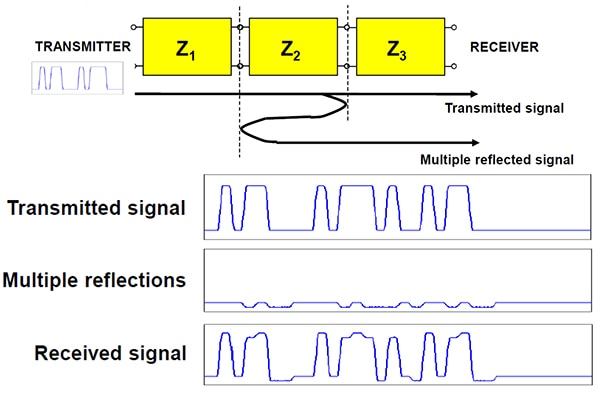 Figure 5: The transmitted signal is distorted by the reflected components summed with time delays proportional to the propagation delays of the reflection’s path. (Image source: Amphenol)
The junction of Z2 and Z3 reflects part of the incident signal back toward the transmitter while the bulk of the incident energy continues to the receiver. The reflected signal encounters a mismatch in the reverse path and is partially reflected back toward the receiver. The edges of the signal are reflected with a polarity dependent on whether the impedance across the junction increases or decreases. The timing of the reflections depends on the physical distance between the junctions. The receiver sees the sum of the transmitted signal and all the reflections.
Note that the received signal has nonuniform top and bottom levels due to the addition of the reflections. If the reflection amplitudes are high enough, errors can occur when reading the data. One of the critical goals of SI is the reduction of reflection anomalies.
Return loss and insertion loss
Transmission lines are characterized in both the frequency and time domains. Reflections are measured as return loss (RL) in units of decibels (dB) in the frequency domain (Figure 6). The portion of the incident power that fails to reach the load is characterized by the insertion loss (IL), also measured in dB. A lower insertion loss translates to a better connection.
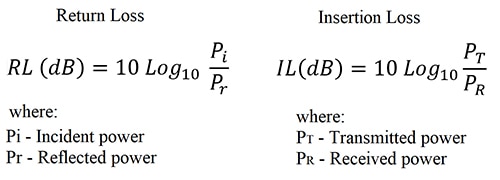 Figure 6: The return loss measures reflected power in the frequency domain, while the insertion loss measures the power received at the load. (Image source: Art Pini)
The parameter describing insertion loss in bulk coaxial cable is attenuation per unit length specified as dB per foot (dB/ft.) or dB per meter (dB/m).
Noise
Noise is any undesired signal that appears on a transmission line. Reflections can be viewed as a type of noise that can corrupt the received signal. Noise on a non-transmitting line can be received as a false signal.
Noise can come from several sources, such as thermal noise, external radiation impinging on a transmission line, and noise from another line within the same device (crosstalk). Energy from these sources adds to the signals on a transmission line. Noise is characterized by the signal-to-noise ratio (SNR), which is the ratio of signal power to noise power on a transmission line. The higher the signal-to-noise ratio, the better the signal quality.
Crosstalk
Crosstalk is a subcategory of unwanted noise that appears on a transmission line due to interactions with electromagnetic (EM) fields originating from adjacent lines without direct contact. Crosstalk is caused by line-to-line capacitive or line-to-line inductive coupling between an aggressor (carrier) and a victim (receiver) line (Figure 7).
 Figure 7: Crosstalk can be caused by capacitive coupling of a voltage change or inductive coupling of a current change from the aggressor to the victim transmission line. (Image source: Amphenol)
Crosstalk is labeled according to where the victim experiences the coupled noise. Near-end crosstalk (NEXT) appears on the transmitter side of a transmission line or device under test (DUT), while far-end crosstalk (FEXT) appears on the receiver side.
Crosstalk can be reduced by increasing the distance between adjacent transmission lines, decreasing the path length, using differential lines that cancel noise common to both lines, keeping traces on adjacent pc board layers perpendicular, and incorporating integral grounding and electromagnetic interference (EMI) shielding.
Resonance
Resonance occurs when a signal’s path is a multiple of a quarter of the signal’s wavelength. At such points, the reflected signal overlaps the incident wave and either amplifies or attenuates the transmitted signal. The frequencies corresponding to these wavelengths are called resonances.
Resonances can cause noise or distort signals, and arise due to unterminated lengths of transmission lines, called stubs, in the signal path or non-ideal ground returns. Figure 8 shows resonance effects due to stubs of several kinds with two different lengths on a 12 gigabit per second (Gbps) channel.
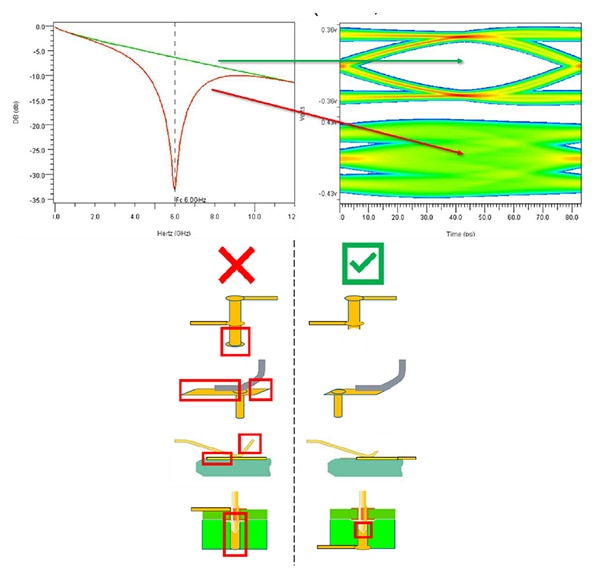 Figure 8: Shown are examples of resonance effects due to transmission line stubs of several kinds with two different lengths on a 12 Gbps channel. (Image source: Amphenol)
The stubs highlighted with red boxes have a length of 0.25 inches (in.), resulting in a resonant frequency of about 6 gigahertz (GHz). The three short stubs under the green checked box have a length of 0.025 in. Their resonant frequency is ten times higher or 60 GHz. Both spectral responses are shown in the spectrum analyzer plot in the upper left. The red spectrum is the response of the 0.25 in. stub, while the green trace is that of the 0.025 in. stub; the 0.25 in. stub shows a “suck out” response centered at 6 GHz with a very low amplitude.
The eye diagram in the upper right corner overlaps multiple-bit sequences of 011, 001, 100, and 110 to produce a graphical SI measurement. As long as the eye remains open, the transmission is successful. Vertical eye closures are due to noise, reflections, and crosstalk. Horizontal eye closures are related to timing issues like jitter. The 6 GHz resonance results in the collapsed eye due to the loss of signal amplitude.
SI in specifications for interconnection components
Interconnection components that support AI processors in data centers include coaxial and twisted pair cables, connectors, and pc boards (Figure 9). These components are usually specified in terms of characteristic impedance and bandwidth. SI specifications include attenuation, velocity factor, return loss, insertion loss, and crosstalk.
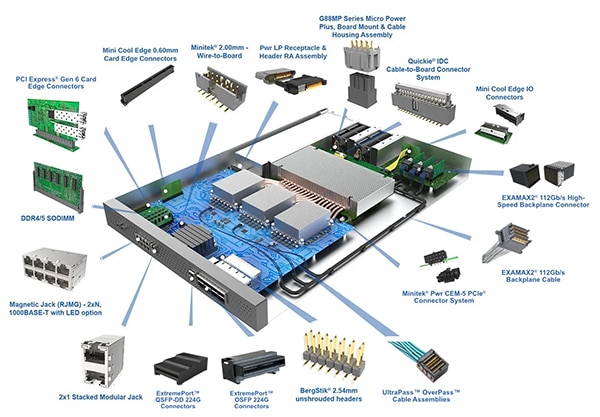 Figure 9: Supporting AI processors in datacenters requires high-speed cables and connectors to ensure accurate and reliable communications between elements. (Image source: Amphenol)
An example of a coaxial cable is Times Microwave Systems’ LMR-400-ULTRAFLEX 50 Ω low-loss cable, rated for indoor or outdoor operation at 6 GHz. Its frequency-dependent attenuation is 0.05 dB/ft. at 900 megahertz (MHz) and increases to 0.13 dB/ft. at 5.8 GHz. Its propagation velocity, a specification used when dealing with reflections, is 80% of the speed of light (a velocity factor of 0.8). Reflection and transmission losses are length-dependent and are not given in bulk cable specifications.
Components such as connectors are specified somewhat differently. The Amphenol Communications Solutions 10128419-101LF 112-position male header connector is intended for backplane use. It is rated to handle digital signals with a maximum bit rate of 25 to 56 Gbps. Its contacts have a characteristic impedance of 92 Ω. As a multiconductor connector, its insertion loss and crosstalk specifications are critical (Figure 10).
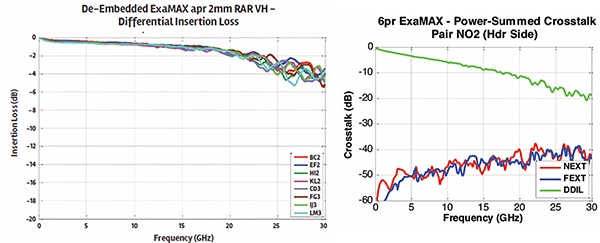 Figure 10: Shown are the significant insertion loss and crosstalk specifications as a function of frequency for the 10128419-101LF header. (Image source: Amphenol)
These are typical SI specifications associated with interconnect components.
Conclusion
SI must be considered throughout the design process for high-speed systems such as AI data centers. Many factors can affect SI, and designers must account for them all to mitigate their effects. SI can be maximized with the proper PC board trace layout and appropriate conductors and connectors.

Disclaimer: The opinions, beliefs, and viewpoints expressed by the various authors and/or forum participants on this website do not necessarily reflect the opinions, beliefs, and viewpoints of DigiKey or official policies of DigiKey.


