How to Rapidly Deploy Edge-Ready Machine Learning Applications
Contributed By DigiKey's North American Editors
2022-08-04
Machine learning (ML) offers tremendous potential for creating smart products, but the complexity and challenges involved in neural network (NN) modeling and creating ML applications for the edge have limited developers’ ability to quickly deliver useful solutions. Although readily available tools have made ML model creation more accessible in general, conventional ML development practices are not designed to meet the unique requirements of solutions for the Internet of Things (IoT), automotive, industrial systems, and other embedded applications.
This article provides a short introduction to NN modeling. It then introduces and describes how to use a comprehensive ML platform from NXP Semiconductors that lets developers more effectively deliver edge-ready ML applications.
A quick review of NN modeling
ML algorithms provide developers with a dramatically different option for application development. Rather than writing software code intended to explicitly solve problems like image classification, developers train NN models by presenting a set of data such as images annotated with the actual name (or class) of the entity contained in the image. The training process uses a variety of methods to calculate a model’s parameters of weights and bias values for each neuron and layer, respectively, enabling the model to provide a reasonably accurate prediction of the correct class of an input image (Figure 1).
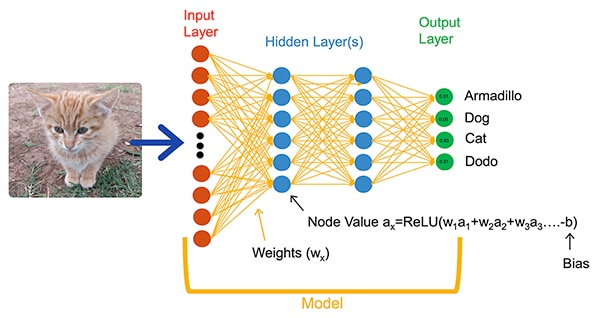 Figure 1: NNs such as this fully connected network classify an input object using weight and bias parameters set during training. (Image source: NXP Semiconductors)
ML researchers have evolved a broad array of NN architectures beyond the generic fully connected NN shown in Figure 1. For example, image classification applications typically utilize the convolutional NN (CNN), a specialized architecture that splits image recognition into an initial phase that finds key features of an image, followed by a classification phase that predicts the likelihood that it belongs in one of several classes established during training (Figure 2).
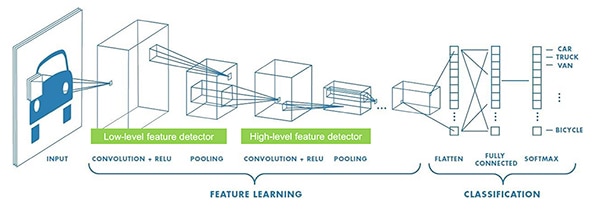 Figure 2: ML experts use specialized NN architectures such as this convolutional neural network (CNN) for specific tasks like image recognition. (Image source: NXP Semiconductors)
Although the selection of an appropriate model architecture and training regimen has been limited to ML experts, the availability of multiple open-source and commercial tools has dramatically simplified model development for large-scale deployments. Today, developers can define models with a few lines of code (Listing 1), and use tools such as the open-source Netron model viewer to generate a graphical representation of the model (Figure 3) for checking each layer definition and connectivity.
Copy
def model_create(shape_in, shape_out):
    from keras.regularizers import l2

    tf.random.set_seed(RANDOM_SEED)

    model = tf.keras.Sequential()
    model.add(tf.keras.Input(shape=shape_in, name='acceleration'))
    model.add(tf.keras.layers.Conv2D(8, (4, 1), activation='relu'))
    model.add(tf.keras.layers.Conv2D(8, (4, 1), activation='relu'))

    model.add(tf.keras.layers.Dropout(0.5))

    model.add(tf.keras.layers.MaxPool2D((8, 1), padding='valid'))
    model.add(tf.keras.layers.Flatten())

    model.add(tf.keras.layers.Dense(64, kernel_regularizer=l2(1e-4), bias_regularizer=l2(1e-4), activation='relu'))
    model.add(tf.keras.layers.Dropout(0.5))
    model.add(tf.keras.layers.Dense(32, kernel_regularizer=l2(1e-4), bias_regularizer=l2(1e-4), activation='relu'))
    model.add(tf.keras.layers.Dropout(0.5))
    model.add(tf.keras.layers.Dense(shape_out, activation='softmax'))
    model.compile(optimizer='adam', loss='categorical_crossentropy', metrics=['acc'])

    return model
Listing 1: Developers can define NN models using only a few lines of code. (Code source: NXP Semiconductors)
 Figure 3: Generated by the Netron viewer, this graphical representation of the model defined in Listing 1 can help the developer document each layer’s function and connectivity. (Image source: Stephen Evanczuk, running Netron on NXP model source code in Listing 1)
For final deployment, other tools strip away model structures required only during training and perform other optimizations to create an efficient inference model.
Why developing ML-based applications for smart products has been so difficult
Defining and training a model for the IoT or other smart products follows a similar workflow as creating a model for enterprise-scale machine learning applications. Beyond that similarity, however, developing ML applications for the edge brings multiple additional challenges. Along with model development, designers face the familiar challenges of developing the main application required to run their microcontroller (MCU)-based product. As a result, bringing ML to the edge requires managing two interrelated workflows (Figure 4).
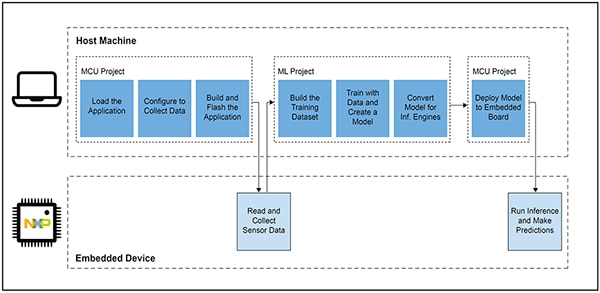 Figure 4: Developing an ML-based application for the edge extends the typical embedded MCU development workflow with an ML workflow required to train, validate, and deploy an ML model. (Image source: NXP Semiconductors)
Although the MCU project workflow is familiar to embedded developers, the ML project can impose additional requirements on the MCU-based application as developers work to create an optimized ML inference model. In fact, the ML project dramatically impacts the requirements of the embedded device. The heavy computational load and memory requirements usually associated with model execution can exceed the resources of microcontrollers used in the IoT and smart products. To reduce resource requirements, ML experts apply techniques like model network pruning, compression, quantization to lower precision, or even single-bit parameters and intermediate values, and other methods.
Even with these optimization methods, however, developers can still find conventional microcontrollers lack the performance needed to handle the large number of mathematical operations associated with ML algorithms. On the other hand, use of a high-performance application processor could handle the ML computational load, but that approach might result in increased latency and non-deterministic response, degrading the real-time characteristics of their embedded design.
Aside from hardware selection challenges, delivering optimized ML models for the edge has additional challenges unique to embedded development. The vast number of tools and methods developed for enterprise-scale ML applications might not scale well to the embedded developer’s application and operating environment. Even seasoned embedded developers expecting to rapidly deploy ML-based devices can find themselves struggling to find an effective solution among a wealth of available NN model architectures, tools, frameworks, and workflows.
NXP addresses both hardware performance and model implementation facets of edge ML development. At the hardware level, NXP’s high-performance i.MX RT1170 crossover microcontrollers meet the broad performance requirements of edge ML. To take full advantage of this hardware base, NXP’s eIQ (edge intelligence) ML software development environment and application software packs offer both inexperienced and expert ML developers an effective solution for creating edge-ready ML applications.
An effective platform for developing edge-ready ML applications
NXP i.MX RT crossover processors combine the real-time, low-latency response of traditional embedded microcontrollers with the execution capabilities of high-performance application processors. NXP’s i.MX RT1170 crossover processor series integrates a power-efficient Arm® Cortex®-M4 and a high-performance Arm Cortex-M7 processor with an extensive set of functional blocks and peripherals needed to run demanding applications, including ML-based solutions in embedded devices (Figure 5).
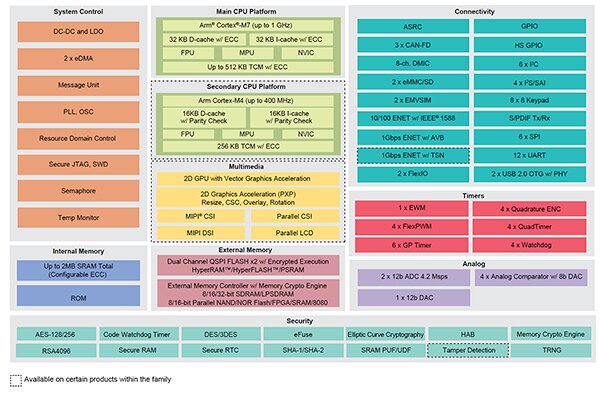 Figure 5: NXP's i.MX RT1170 crossover processors combine the power-efficient capability of conventional microcontrollers with the high-performance processing capability of application processors. (Image source: NXP Semiconductors)
Fully integrated into NXP’s MCUXpresso SDK and Yocto development environments, the NXP eIQ environment is designed specifically to facilitate implementation of inference models on embedded systems built with NXP microprocessors and microcontrollers. Included in the eIQ environment, the eIQ Toolkit supports bring your own data (BYOD) and bring your own model BYOM workflows through several tools, including the eIQ Portal, the eIQ Model Tool, and command line tools (Figure 6).
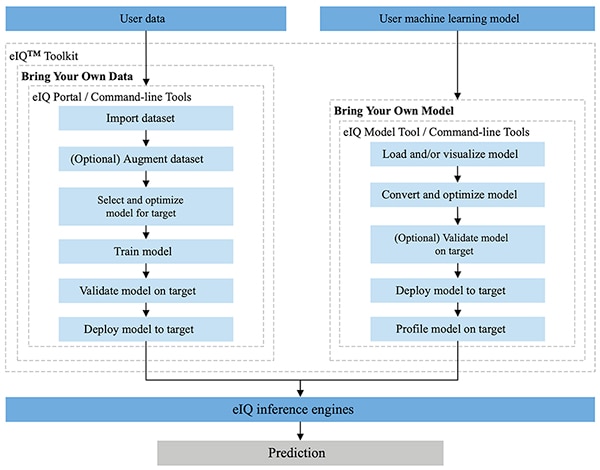 Figure 6: The NXP eIQ Toolkit supports BYOD developers who need to create a model and BYOM developers who need to deploy their own existing model to a target system. (Image source: NXP Semiconductors)
Designed to support BYOD workflows for both experts and developers new to ML model development, the eIQ Portal provides a graphical user interface (GUI) that helps developers more easily complete each stage of the model development workflow.
In the initial stage of development, the eIQ Portal’s data set curator tool helps developers import data, capture data from a connected camera, or capture data from a remote device (Figure 7).
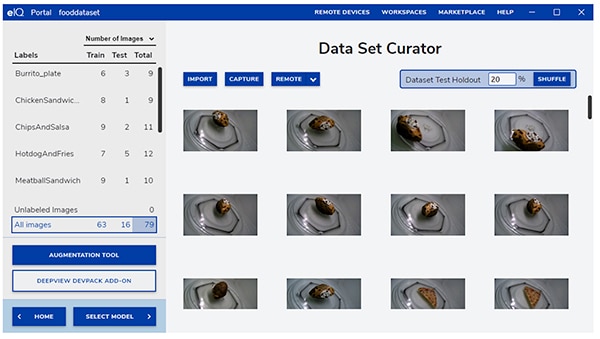 Figure 7: The eIQ Portal's data set curator tool facilitates the critical task of training-data preparation. (Image source: NXP Semiconductors)
Using the data set curator tool, developers annotate, or label, each item in the dataset by labeling the entire image, or just specific regions contained within a specified bounding box. An augmentation feature helps developers provide the needed diversity to the dataset by blurring images, adding random noise, changing characteristics such as brightness or contrast, and other methods.
In the next phase, the eIQ Portal helps developers select the type of model best suited to the application. For developers uncertain as to the model type, a model selection wizard steps developers through the selection process based on the type of application and hardware base. Developers who already know what type of model they need can select a custom model provided with the eIQ installation or other custom implementations.
The eIQ Portal takes developers through the next critical training step, providing an intuitive GUI for modifying training parameters and viewing the changes in model prediction accuracy with each training step (Figure 8).
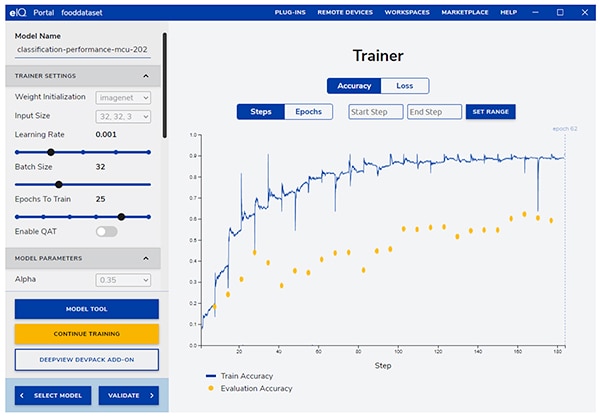 Figure 8: Developers use the eIQ Portal’s trainer tool to observe improvement in training accuracy with each step, and to modify them if needed. (Image source: NXP Semiconductors)
In the next step, the eIQ Portal GUI helps developers validate the model. In this stage, the model is converted to run on the target architecture to determine its actual performance. When validation completes, the validation screen displays the confusion matrix—a fundamental ML validation tool that allows developers to compare the input object’s actual class with the class predicted by the model (Figure 9).
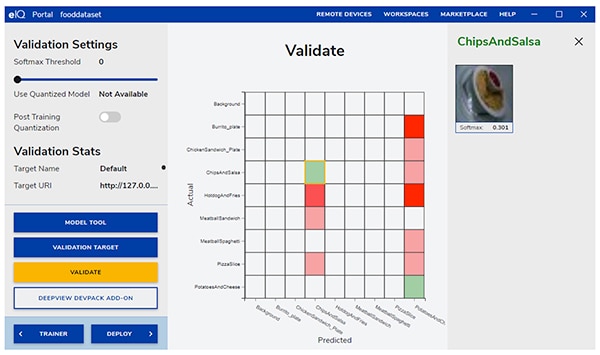 Figure 9: The eIQ Portal's validation tool provides developers with the confusion matrix resulting from running a model on a target architecture. (Image source: NXP Semiconductors)
For final deployment, the environment provides developers with a choice of target inference engines depending on the processor, including:
- Arm CMSIS-NN (Common Microcontroller Software Interface Standard, Neural Network)—neural network kernels developed to maximize the performance and minimize the memory footprint of neural networks on Arm Cortex-M processor cores
- Arm NN SDK (neural network, software development kit)—a set of tools and inference engine designed to bridge between existing neural network frameworks and Arm Cortex-A processors, among others
- DeepViewRT—NXP’s proprietary inference engine for i.MX RT crossover MCUs
- Glow NN—based on Meta’s Glow (graph lowering) compiler and optimized by NXP for Arm Cortex-M cores by using function calls to CMSIS-NN kernels or the Arm NN library if available, otherwise by compiling code from its own native library
- ONXX Runtime—Microsoft Research’s tools designed to optimize performance for Arm Cortex-A processors.
- TensorFlow Lite for Microcontrollers—a smaller version of TensorFlow Lite, optimized for running machine learning models on i.MX RT crossover MCUs
- TensorFlow Lite—a version of TensorFlow providing support for smaller systems
For BYOM workflows, developers can use the eIQ Model Tool to move directly to model analysis and per-layer time profiling. For both BYOD and BYOM workflows, developers can use eIQ command line tools which provide access to tool functionality, as well as eIQ features not available directly through the GUI.
Besides the features described in this article, the eIQ Toolkit supports an extensive set of capabilities, including model conversion and optimization that is well beyond the scope of this article. However, for rapid prototyping of edge-ready ML applications, developers can generally move quickly through development and deployment with little need to employ many of the more sophisticated capabilities of the eIQ environment. In fact, specialized Application Software (App SW) Packs from NXP offer complete applications that developers can use for immediate evaluation, or as the basis of their own custom applications.
How to quickly evaluate model development using an App SW Pack
NXP App SW Packs provide a complete ML-based application, combining production-ready source code, drivers, middleware, and tools. For example, the NXP ML State Monitor App SW Pack offers an immediate ML-based solution to the frequent problem of determining the state of complex systems based on sensor inputs (Figure 10).
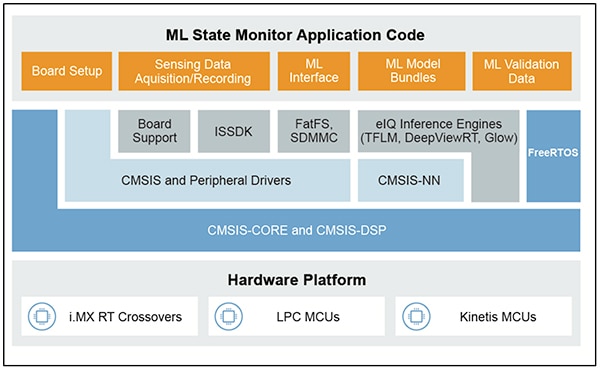 Figure 10: Developers can use NXP App SW Packs such as the ML State Monitor App SW Pack for immediate evaluation, or as the basis of custom code development. (Image source: NXP Semiconductors)
The ML State Monitor App SW Pack implements a complete solution for an application intended to detect when a fan is operating in one of four states:
- ON
- OFF
- CLOGGED, when the fan is on but the airflow is obstructed
- FRICTION, when the fan is on but one or more fan blades are encountering excess friction during operation
Just as important for model developers, the ML State Monitor App SW Pack includes ML models as well as a complete data set representing accelerometer readings from a fan operating in each of those four states.
Developers can study code, models and data provided in the ML State Monitor App SW Pack to understand how to use the sensor data to train a model, create an inference model, and validate the inference against a validation sensor data set. In fact, NXP’s ML_State_Monitor.ipynb Jupyter Notebook, included in the App SW Pack, provides an immediate, out-of-the-box tool for studying the model development workflow well before any hardware deployment.
The Jupyter Notebook is an interactive browser-based Python execution platform that allows developers to immediately view the results of Python code execution. Running a Jupyter Notebook generates a block of Python code, immediately followed by the results of running that code block. These results are not simply static displays but are the actual results obtained by running the code. For example, when developers run NXP’s ML_State_Monitor.ipynb Jupyter Notebook, they can immediately view a summary of the input dataset (Figure 11).
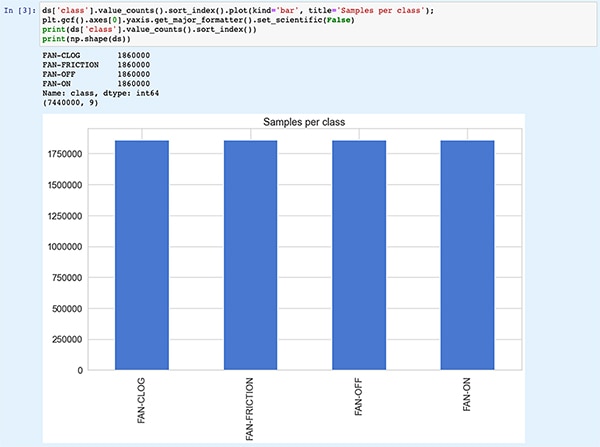 Figure 11: NXP's ML_State_Monitor.ipynb Jupyter Notebook lets developers work interactively through the neural network model development workflow, viewing training data provided in the ML State Monitor App SW Pack. [Note: Code truncated here for display purposes.] (Image source: Stephen Evanczuk, running NXP’s ML_State_Monitor.ipynb Jupyter Notebook)
The next section of code in the Notebook provides the user with a graphical display of the input data, presented as separate plots for time sequence and frequency (Figure 12).
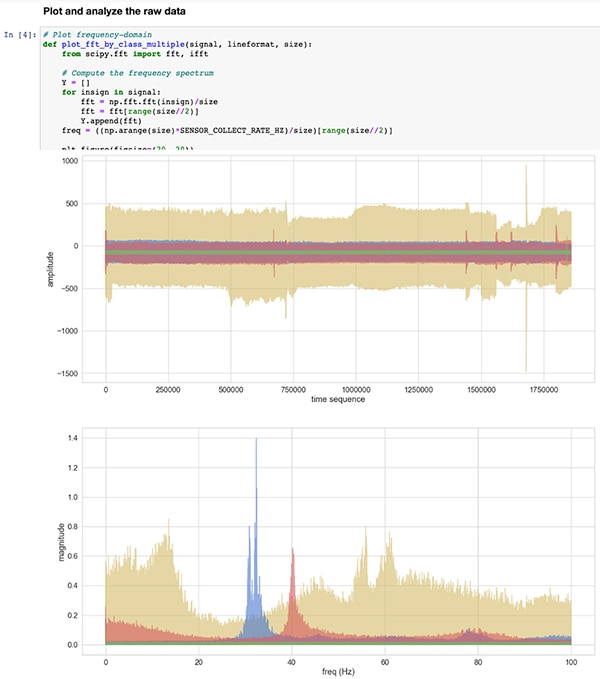 Figure 12: The Jupyter Notebook provides developers with time series and frequency displays of the sample fan state data set (OFF: green; ON: red; CLOGGED: blue; FRICTION: yellow). [Note: Code truncated for presentation purposes.] (Image source: Stephen Evanczuk, running NXP’s ML_State_Monitor.ipynb Jupyter Notebook)
Additional code sections provide further data analysis, normalization, shaping, and other preparation until code execution reaches the same model creation function definition, model_create(), shown earlier in Listing 1. The very next code section executes this model_create() function and prints a summary for quick validation (Figure 13).
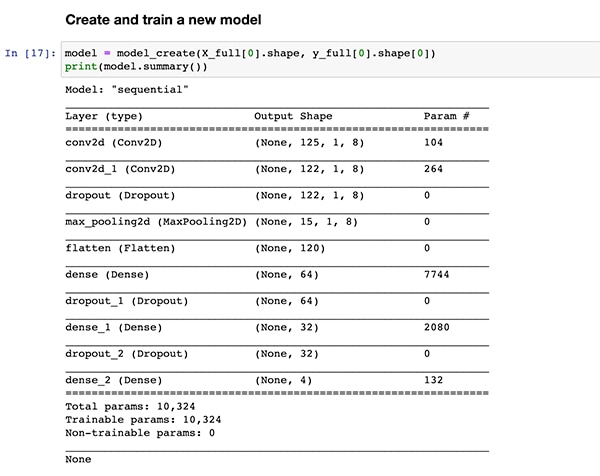 Figure 13: NXP's ML_State_Monitor.ipynb Jupyter Notebook creates the model (shown in Listing 1) and displays the model summary information. (Image source: Stephen Evanczuk, running NXP’s ML_State_Monitor.ipynb Jupyter Notebook)
Following a section of code for model training and evaluation, the ML_State_Monitor.ipynb Jupyter Notebook displays each confusion matrix for the full dataset, the training dataset, and the validation dataset (a subset of the dataset excluded from the training dataset). In this case, the confusion matrix for the complete dataset shows good accuracy with some amount of error, most notably where the model confuses a small percentage of datasets as being in the ON state when they are actually in the CLOGGED state as annotated in the original dataset (Figure 14).
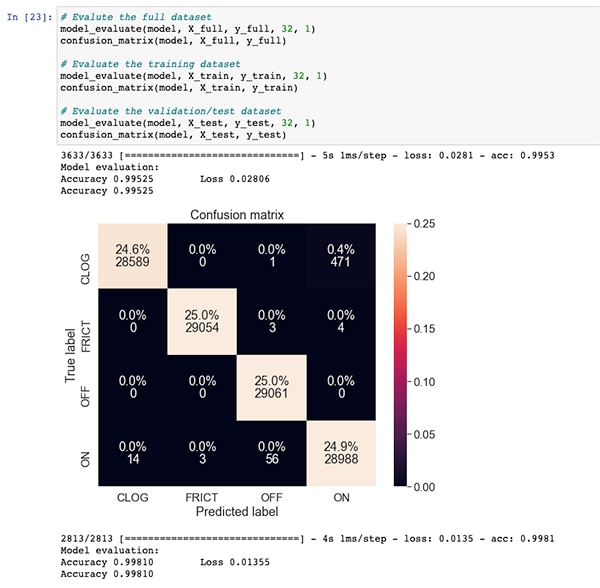 Figure 14: Developers can view confusion matrices such as this one for the full dataset. (Image source: Stephen Evanczuk, running NXP's ML_State_Monitor.ipynb Jupyter Notebook)
In a later code section, the model is exported to several different model types and formats used by the various inference engines supported by the eIQ development environment (Figure 15).
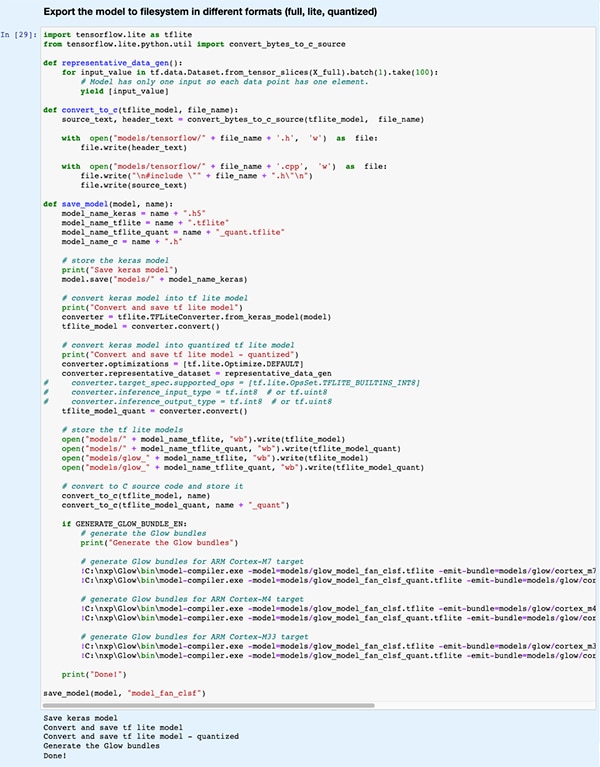 Figure 15: NXP's ML_State_Monitor.ipynb Jupyter Notebook demonstrates how developers can save their trained model in several different model types and formats. (Image source: Stephen Evanczuk, running NXP’s ML_State_Monitor.ipynb Jupyter Notebook)
The choice of inference engine can be critically important for meeting specific performance requirements. For this application, NXP measured model size, code size, and inference time (time required to complete inference on a single input object) when the model is targeted to several inference engines, one running at 996 megahertz (MHz) and one running at 156 MHz (Figures 16 and 17).
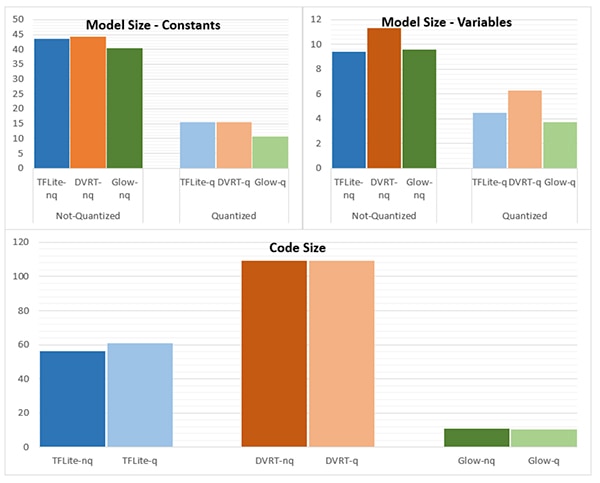 Figure 16: Choice of model type can dramatically impact model size, although the dramatic differences shown here might not apply for larger models. (Image source: NXP Semiconductors)
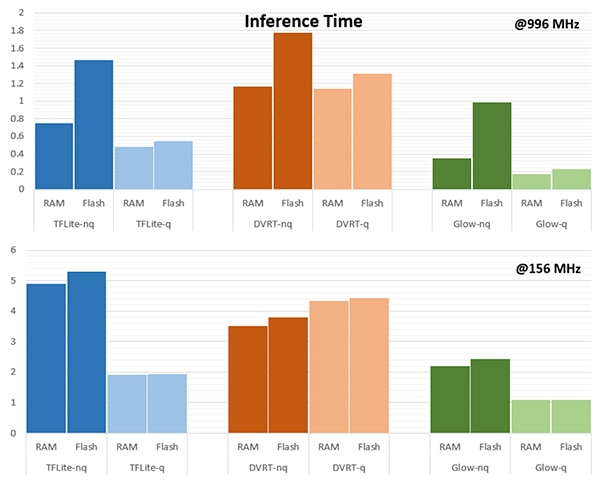 Figure 17: Inference time can differ significantly for evaluation of an input object when loaded from RAM or flash memory, or when operating the processor at a higher frequency of 996 MHz vs 156 MHz. (Image source: NXP Semiconductors)
As NXP notes, this sample application uses a very small model, so the rather stark differences shown in these figures might be substantially less pronounced in a larger model used for complex classifications.
Building a system solution for state monitoring
Besides the Jupyter Notebook for interactive exploration of the model development workflow, the NXP ML State Monitoring App SW Pack provides complete source code for implementing the design on NXP’s MIMXRT1170-EVK evaluation board. Built around an NXP MIMXRT1176DVMAA crossover MCU, the evaluation board provides a comprehensive hardware platform, complete with additional memory and multiple interfaces (Figure 18).
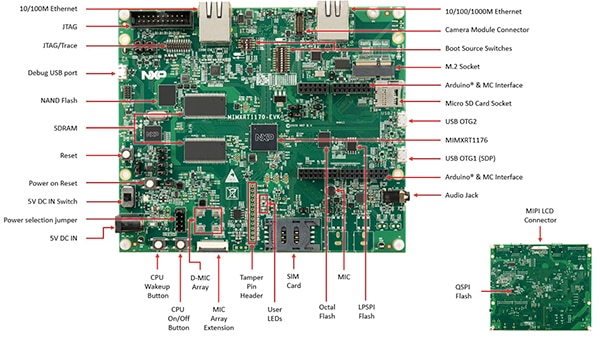 Figure 18: NXP's MIMXRT1170-EVK evaluation board provides a comprehensive hardware platform for the development of applications based on the NXP i.MX RT1170 series crossover MCU. (Image source: NXP Semiconductors)
Developers can use the NXP fan state application to predict the state of a fan by stacking the MIMXRT1170-EVK evaluation board with an optional NXP FRDM-STBC-AGM01 sensor board, an Arduino shield, and a suitable 5 volt brushless DC fan such as Adafruit’s 4468 (Figure 19).
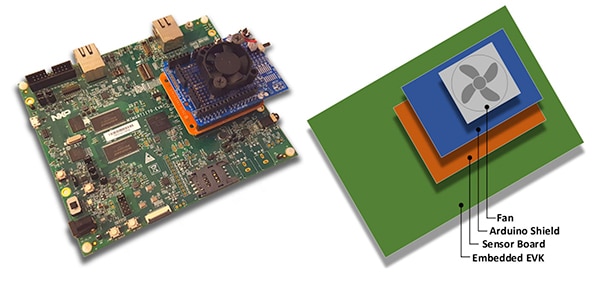 Figure 19: Developers can test the NXP fan state sample application with a simple stack built on the MIMXRT1170-EVK evaluation board. (Image source: NXP Semiconductors)
Using the MCUXpresso integrated development environment (IDE), developers can configure the application to simply acquire and store the fan-state data, or immediately run inference on the acquired data using a TensorFlow inference engine, DeepViewRT inference engine, or Glow inference engine (Listing 2).
Copy
/* Action to be performed */
#define SENSOR_COLLECT_LOG_EXT                  1   // Collect and log data externally
#define SENSOR_COLLECT_RUN_INFERENCE            2   // Collect data and run inference

/* Inference engine to be used */
#define SENSOR_COLLECT_INFENG_TENSORFLOW        1   // TensorFlow
#define SENSOR_COLLECT_INFENG_DEEPVIEWRT        2   // DeepViewRT
#define SENSOR_COLLECT_INFENG_GLOW              3   // Glow

/* Data format to be used to feed the model */
#define SENSOR_COLLECT_DATA_FORMAT_BLOCKS       1   // Blocks of samples
#define SENSOR_COLLECT_DATA_FORMAT_INTERLEAVED  2   // Interleaved samples


/* Parameters to be configured by the user: */
/* Configure the action to be performed */
#define SENSOR_COLLECT_ACTION                   SENSOR_COLLECT_RUN_INFERENCE

#if SENSOR_COLLECT_ACTION == SENSOR_COLLECT_LOG_EXT
/* If the SD card log is not enabled the sensor data will be streamed to the terminal */
#define SENSOR_COLLECT_LOG_EXT_SDCARD           1   // Redirect the log to SD card, otherwise print to console
Listing 2: Developers can easily configure the NXP ML State Monitor sample application by modifying defines included in the sensor_collect.h header file. (Code source: NXP Semiconductors)
The application operates with a straightforward process flow. The main routine in main.c creates a task called MainTask, which is a routine located in the sensor_collect.c module.
Copy
void MainTask(void *pvParameters)
{
    status_t status = kStatus_Success;

    printf("MainTask started\r\n");

#if !SENSOR_FEED_VALIDATION_DATA
    status = SENSOR_Init();
    if (status != kStatus_Success)
    {
        goto main_task_exit;
    }
#endif

    g_sensorCollectQueue = xQueueCreate(SENSOR_COLLECT_QUEUE_ITEMS, sizeof(sensor_data_t));
    if (NULL == g_sensorCollectQueue)
    {
        printf("collect queue create failed!\r\n");
        status = kStatus_Fail;
        goto main_task_exit;
    }

#if SENSOR_COLLECT_ACTION == SENSOR_COLLECT_LOG_EXT
    uint8_t captClassLabelIdx;
    CAPT_Init(&captClassLabelIdx, &g_SensorCollectDuration_us, &g_SensorCollectDuration_samples);
    g_SensorCollectLabel = labels[captClassLabelIdx];

    if (xTaskCreate(SENSOR_Collect_LogExt_Task, "SENSOR_Collect_LogExt_Task", 4096, NULL, configMAX_PRIORITIES - 1, NULL) != pdPASS)
    {
        printf("SENSOR_Collect_LogExt_Task creation failed!\r\n");
        status = kStatus_Fail;
        goto main_task_exit;
    }
#elif SENSOR_COLLECT_ACTION == SENSOR_COLLECT_RUN_INFERENCE
    if (xTaskCreate(SENSOR_Collect_RunInf_Task, "SENSOR_Collect_RunInf_Task", 4096, NULL, configMAX_PRIORITIES - 1, NULL) != pdPASS)
    {
        printf("SENSOR_Collect_RunInf_Task creation failed!\r\n");
        status = kStatus_Fail;
        goto main_task_exit;
    }
#endif
Listing 3: In the NXP ML State Monitor sample application, MainTask invokes a subtask to acquire data or run inference. (Code source: NXP Semiconductors)
MainTask performs various initialization tasks before launching one of two subtasks, depending on the defines set by the user in sensor_collect.h:
- if SENSOR_COLLECT_ACTION is set to SENSOR_COLLECT_LOG_EXT, MainTask starts the subtask SENSOR_Collect_LogExt_Task(), which collects data and stores it on the SD card if configured
- if SENSOR_COLLECT_ACTION is set to SENSOR_COLLECT_RUN_INFERENCE, MainTask starts the subtask SENSOR_Collect_RunInf_Task(), which runs the inference engine (Glow, DeepViewRT, or TensorFlow) defined in sensor_collect.h against the collected data, and if SENSOR_EVALUATE_MODEL is defined, displays the resulting performance and classification prediction
Copy
if SENSOR_COLLECT_ACTION == SENSOR_COLLECT_LOG_EXT
void SENSOR_Collect_LogExt_Task(void *pvParameters)
{
[code deleted for simplicity]
    while (1)
    {
[code deleted for simplicity]
            bufSizeLog = snprintf(buf, bufSize, "%s,%ld,%d,%d,%d,%d,%d,%d,%d\r\n", g_SensorCollectLabel, (uint32_t)(sensorData.ts_us/1000),
                    sensorData.rawDataSensor.accel[0], sensorData.rawDataSensor.accel[1], sensorData.rawDataSensor.accel[2],
                    sensorData.rawDataSensor.mag[0], sensorData.rawDataSensor.mag[1], sensorData.rawDataSensor.mag[2],
                    sensorData.temperature);

#if SENSOR_COLLECT_LOG_EXT_SDCARD
                SDCARD_CaptureData(sensorData.ts_us, sensorData.sampleNum, g_SensorCollectDuration_samples, buf, bufSizeLog);
#else
                printf("%.*s", bufSizeLog, buf);
[code deleted for simplicity]
    }

    vTaskDelete(NULL);
}
#elif SENSOR_COLLECT_ACTION == SENSOR_COLLECT_RUN_INFERENCE
[code deleted for simplicity]

void SENSOR_Collect_RunInf_Task(void *pvParameters)
{
[code deleted for simplicity]
    while (1)
    {
[code deleted for simplicity]
                /* Run Inference */
                tinf_us = 0;
                SNS_MODEL_RunInference((void*)g_clsfInputData, sizeof(g_clsfInputData), (int8_t*)&predClass, &tinf_us, SENSOR_COLLECT_INFENG_VERBOSE_EN);

[code deleted for simplicity]
#if SENSOR_EVALUATE_MODEL
                /* Evaluate performance */
                validation.predCount++;
                if (validation.classTarget == predClass)
                {
                    validation.predCountOk++;
                }
                PRINTF("\rInference %d?%d | t %ld us | count: %d/%d/%d | %s      ",
                       validation.classTarget, predClass, tinf_us, validation.predCountOk,
                       validation.predCount, validation.predSize, labels[predClass]);

                tinfTotal_us += tinf_us;
                if (validation.predCount >= validation.predSize)
                {
                    printf("\r\nPrediction Accuracy for class %s %.2f%%\r\n", labels[validation.classTarget],
                            (float)(validation.predCountOk * 100)/validation.predCount);
                    printf("Average Inference Time %.1f (us)\r\n", (float)tinfTotal_us/validation.predCount);
                    tinfTotal_us = 0;
                }
#endif

    }

exit_task:
    vTaskDelete(NULL);
}
#endif  /* SENSOR_COLLECT_ACTION */
Listing 4: The NXP ML State Monitor sample application demonstrates the basic design pattern for acquiring sensor data and running the selected inference engine on the acquired data. (Code source: NXP Semiconductors)
Because the NXP ML State Monitor App SW Pack provides full source code along with a complete set of required drivers and middleware, developers can easily extend the application to add features or use it as the starting point for their own custom development.
Conclusion
Implementing ML at the edge in smart products in the IoT and other applications can provide a powerful set of features, but has often left developers struggling to apply ML tools and methods developed for enterprise-scale applications. With the availability of an NXP development platform comprising crossover processors and specialized model development software, both ML experts and developers with little or no ML experience can more effectively create ML applications designed specifically to meet the requirements for efficient edge performance.

Disclaimer: The opinions, beliefs, and viewpoints expressed by the various authors and/or forum participants on this website do not necessarily reflect the opinions, beliefs, and viewpoints of DigiKey or official policies of DigiKey.


