Development Tools Tune Power Consumption for MCUs
Contributed By DigiKey's European Editors
2017-06-06
One aspect ties together many devices that will make up the Internet of Things (IoT): the requirement for low energy consumption. Addressing this need calls for optimization at multiple levels in a holistic strategy. A successful design entails not just picking low-power components, but also using software to eke out the available battery capacity by having those components work together in the most efficient way. Even subtle changes to hardware and software implementation can make large differences to overall energy usage.
The heart of most IoT devices is a microcontroller (MCU) designed for high energy efficiency. A typical low energy MCU includes an array of intelligent peripherals that control I/O and essential system functions on behalf of the core processor. A serial port (UART) will often be able to send and receive data autonomously, while software running on the processor core is only required to transfer bytes from the appropriate buffer once data reception has completed. With the linked DMA transfers available on devices such as the Gecko EFM32 range of MCUs from Silicon Labs, even that interaction can be minimized. In this case, the processor core need only wake up to inspect the contents of memory once an entire message has been received.
By allowing peripherals to manage I/O, the MCU can spend much of its time in sleep mode, where many parts of the MCU will be shut down and not draw power. Duty cycle is the ratio of time spent in active mode vs time spent asleep. A low duty cycle is important to battery powered IoT applications since sleep modes draw mere microamps, while active mode typically draws several orders of magnitude more.
A low duty cycle allows the processor core to sleep for a majority of the time, waking only to collect data or to communicate when necessary. The key to implementing a low duty cycle strategy is understanding how the software interacts with the hardware. Functions that cause the MCU to be awake too long need to be identified and then replaced or rewritten if possible. Traditionally, this has been difficult to achieve early in the development phase because such identification relies on finished hardware for testing.
The Pearl Gecko starter kit and similar evaluation boards from Silicon Labs include an Advanced Energy Monitor (AEM) function. When used in combination with the advanced tools in the company’s Simplicity Studio, it provides valuable insight into how much energy an application requires during the software development cycle. The information not only shows the effectiveness of sleep modes, but also function-level optimizations.
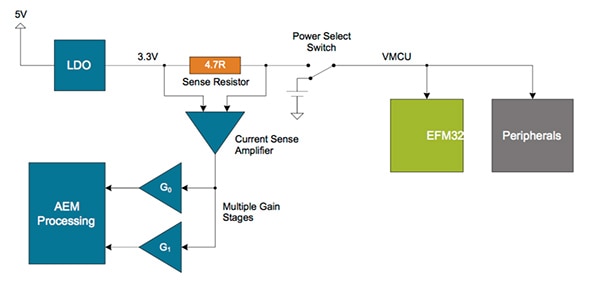
Figure 1: Implementation of the AEM module on the Pearl Gecko starter kit board.
The AEM function monitors the current flowing from an onboard LDO that draws power from the USB bus. Typically, the USB will be used to support debugging and the downloading of software into the target MCU. As illustrated in Figure 1, when the onboard switch is set to battery operated mode, current measurements are not possible.
When the power switch is set to AEM mode, data collected by the board controller is relayed to the Simplicity Studio tools and can be displayed using the Energy Profiler. The AEM can measure currents across a wide range of 0.1 μA to 50 mA, a dynamic range of 114 dB. This allows precise analysis of the impact of different sleep mode states as well as active mode power consumption.
In order to accurately measure the current draw across such a wide range, a current sense amplifier is employed together with a dual gain stage. The amplifier measures the voltage drop across a small series resistor, and the gain stage further amplifies this voltage with two different gain settings, obtaining two current ranges. The transition between these two ranges occurs around 250 μA. Digital filtering and averaging is done within the evaluation board controller before the samples are exported.
On each timer tick, the AEM samples and converts the current, and sends it together with voltage and timing information via USB to the development tools, generating up to 6250 current samples per second.
Because energy profiling relies on trace data for correlation, the code running on the MCU needs to be compiled to contain statements that send Debug With Arbitrary Record Format (DWARF) data. The program counter (PC) samples sent to the debugger are correlated with the object file using the debug data to find the relevant source file, function and C code line running on the MCU. This allows power measurements to be tied to individual functions and tasks.
The user has access to three windows when using the profiling tool inside Simplicity Studio. These show the relevant code, the current consumption graph and a function level view. By clicking on any point over the current graph, a part of the code in the code listing window will be highlighted. This corresponds to the actual piece of code running at that given moment, and with that given level of current consumption. The function listing provides the total energy consumed by each function and its percentage of the measured total for the overall application. If the user wants to analyze the profiling information at a later time, it is possible to export the data to a file and then import it for further analysis.
To illustrate the use of the power monitoring tools available in Simplicity Studio, we’ll take a look at the example of an MCU communicating over a UART port. A straightforward way to move data from the Gecko’s LEUART buffer into main memory for later processing is to regularly poll the peripheral. If data is available, a status flag (LEUART_STATUS_RXDATAV) will indicate that data can be retrieved.
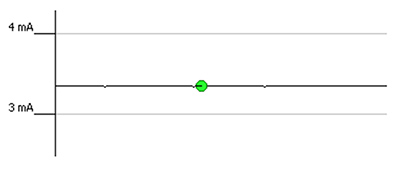
Figure 2: High long-term power consumption with serial port polling.
Running the code on an active processor core results in a constant current consumption of several milliamps. By clicking on the graph, the function causing the drain can be highlighted. To save energy, the MCU needs to avoid using polling to check for data availability. This can be achieved by putting the processor to sleep between data fetches, and using interrupts to wake the processor when reception buffer data becomes available. The current consumption drops significantly during sleep, and spikes while the interrupt service routine (ISR) is running. This can be seen by pinpointing the ISR in the energy profiler window.
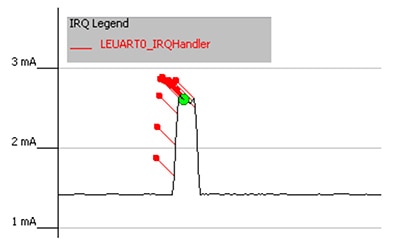
Figure 3: Implementation of interrupt service response reduces high current consumption to shorter periods of time.
However, once a data reception interrupt has been dealt with, other parts of the code may be shown to be drawing more power than expected by keeping the processor active. Clicking on the relevant functions shows that the transmission functions are now responsible for the extra power consumption. While a simple way to program a transmission function is to set a while{} loop to wait for the transmission of each byte to finish, it will keep the processor running longer than necessary. Similar to the situation with the receive port, the loop can be replaced by an interrupt that wakes the processor after each byte transmission completes. The processor now goes into sleep mode between each frame byte, thus lowering the average current consumption.
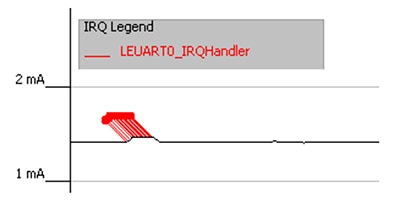
Figure 4: Sleeping in between byte-level transmissions reduces power consumption further.
The LEUART module on the Gecko MCUs can be functional in a deep sleep mode. In this mode the high frequency oscillators are shut down, but the low frequency oscillators (RC or crystal) are still running and clocking the LEUART. Making use of such a mode allows the current draw to drop to microamps in between ISR handling.
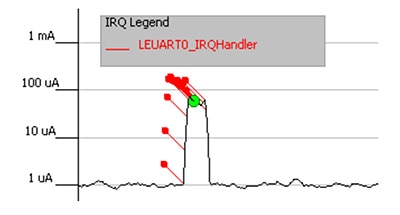
Figure 5: Use of deep sleep modes improves energy efficiency for low duty cycle applications.
Further improvements can be made by moving more of the buffer handling to the linked DMA engine, having it become responsible for triggering interrupts once entire frames have been sent or received. Such a strategy lets the processor core sleep longer, with power optimization focusing on data analysis tasks at the function level.
Conclusion:
The above example demonstrates the importance of current monitoring and debugging tools in optimizing energy efficiency in MCU applications. Rather than waiting until the end of development to perform energy optimization, analysis can be carried throughout the entire development stage, with iterative improvements clearly visible to the developer. Coupled with advanced sleep modes and intelligent hardware that can function without processor intervention for long periods, engineering teams can readily deliver major improvements in energy efficiency.

Disclaimer: The opinions, beliefs, and viewpoints expressed by the various authors and/or forum participants on this website do not necessarily reflect the opinions, beliefs, and viewpoints of DigiKey or official policies of DigiKey.


