Build an Effective Test Harness for Microcontroller Software
Contributed By DigiKey's North American Editors
2017-11-29
Embedded systems are becoming smarter, connected, and far more complex. For embedded systems to remain robust and as close to error free as possible, development teams need effective ways to test and validate that their systems work as expected. The most critical and often most difficult area to test has been the software running on microcontrollers.
Microcontroller software testing has often lagged behind the testing performed on application processor-based devices due to the difficulty in using modern testing techniques on resource-constrained devices. However, several new advances in debugging technologies coupled with traditional test harness design techniques are now allowing embedded system developers to more effectively test their systems software.
This article will show developers how to use these new techniques and the equipment and tools required to implement them.
The changing requirements of embedded test
The modern embedded system test harness requires that developers include four primary components to fully test their system (Figure 1):
- A trace capable debugger
- A communication adapter/sniffer
- A logic analyzer
- An analog-to-digital converter (ADC)
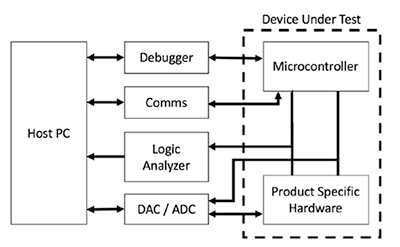
Figure 1: The various interfaces and tools necessary to test an embedded system include a debugger, a communication converter, a logic analyzer, and an analog-to-digital converter. (Image source: Beningo Embedded Group)
These four components allow a developer to test their embedded software at the system level, microcontroller level, and down into the very instructions that are being executed by the microprocessor. This is critical in today’s development environment to ensure that the systems being built not only meet their requirements, but also are able to operate reliably.
A quick examination of Figure 1 may look like a very traditional embedded system test harness, but the advances and the new capabilities really come from a new way to analyze what is happening in the microcontroller, known as Deep Insight Analysis.
Leveraging Deep Insight Analysis to test software
Deep Insight Analysis provides a developer with the ability to analyze their system at run-time. Deep Insight Analysis has three key components:
- RTOS-aware debugging
- Run-time analysis
- Profiling and code-coverage analysis
Developers will typically design their application and use basic debugging techniques such as break point debugging to try to understand how their system works, and shortly thereafter start testing. Testing with just break points in place is superficial and really doesn’t tell a developer anything about what is really happening in the microcontroller. Using Deep Insight Analysis, developers go beyond just basic test and debugging by digging deeper into the RTOS, run-time behavior and execution profile and coverage (Figure 2).

Figure 2: Deep Insight Analysis goes beyond just basic test and debugging by digging deeper into the RTOS, run-time behavior and execution profile and coverage. (Source: Beningo Embedded Group)
Adding Deep Insight Analysis to a test harness requires that a developer use professional debugging tools such as Segger Microcontroller Systems‘ J-Trace or J-Link Ultra+ (Figure 3). The J-Link Ultra+ uses a standard JTAG or SWD interface to retrieve trace data from the onboard debugging module. This information can be used to perform several different analyses such as RTOS-aware debugging.
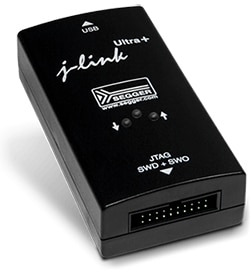
Figure 3: Segger’s J-Link Ultra+ uses a standard JTAG or SWD interface to retrieve trace data from the onboard debugging module. (Image source: Segger Microcontroller Systems)
RTOS-aware debugging allows a developer to monitor how their tasks are performing while they execute their test cases. A developer can gain insights such as
- Maximum stack usage
- Task run count
- Task status
An example test session using Segger’s embOS RTOS with Embedded Studio is shown (Figure 4). This view provides a developer with insights into how their RTOS is behaving, but it doesn’t provide a complete view on how the application is behaving.

Figure 4: RTOS-aware debugging example using Segger’s embOS RTOS and Embedded Studio IDE. (Image source: Beningo Embedded Group)
Developers can further enhance their test harness by using Segger’s free SystemView utility or Percepio’s Tracealyzer tool. These tools provide a developer with run-time analysis to visually see and analyze how the application performed while running the test suite. In order to capture this trace data, developers need to configure their application for tracing within their IDE or with the configuration tool they are using. If no tool is being used, they can integrate the low-level libraries manually.
The run-time analysis provides developers with a wealth of information concerning how their application is behaving (Figure 5). For example, developers can:
- Track event timing and order
- Get maximum, minimum and average execution times
- Visually see tasks executing and when the tasks switch
- Monitor CPU load
- Analyze task statistics
- Identify potential issues such as priority inversion, task jitter and deadlock
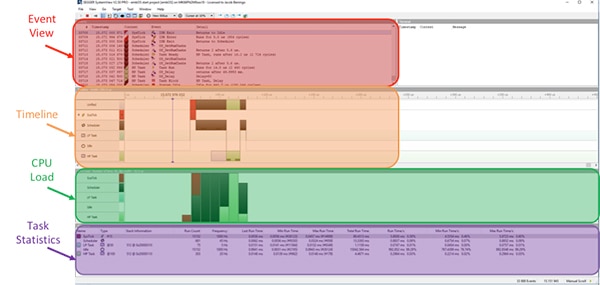
Figure 5: Run-time analysis using the trace tool SystemView. (Image source: Beningo Embedded Group)
Despite adding RTOS aware debugging and run-time analysis to the test harness, this may still not be enough. In many instances, bugs often hide in the code that was never executed during a test. For developers, figuring out which code lines have been executed can be quite challenging. This is where using a tool like J-Trace can come in extremely handy.
How to track executed code
J-Trace uses the embedded trace macrocell (ETM) port on a microcontroller to perform instruction tracing. Instruction tracing allows the J-Trace to “see” every single CPU instruction that is executed on the processor and the exact path the code takes.
Using this analysis in the test harness allows a developer to determine whether their test cases have covered 80%, 90% or 100% code coverage. If the test coverage was only 95%, and they needed 100% in order to ship their product, they could use a free utility like Ozone to see which code lines had been executed, and more importantly, those that hadn’t (Figure 6). New test cases could then be added that would ensure that those missed lines were executed in the testing.
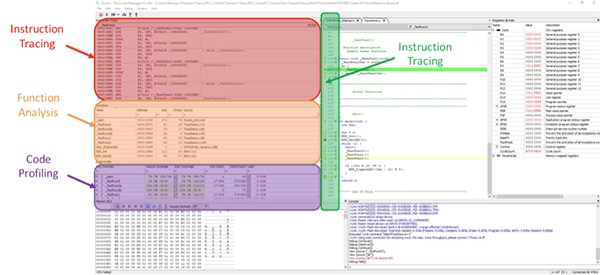
Figure 6: Code profiling analysis being performed using Ozone. (Image source: Beningo Embedded Group)
A developer armed with the powerful tools provided in a Deep Insight Analysis, is now free to focus on the remaining components necessary to build out an effective test harness. The next component that is critical in the test harness are the tools selected to communicate with the microcontroller and stimulate its behavior during testing.
Commanding and controlling the embedded system
Every embedded system will have different requirements for how they interact with the world around them. Some devices may communicate over a simple UART, while others may use CAN or TCP/IP. In order to successfully get a test harness that can communicate with the system and command it, developers need to add to their harness communication hardware and software.
Despite embedded systems using a wide variety of communication interfaces, there is usually one that is used more than any other, the UART. Embedded software developers are accustomed to using the UART and including this interface in the test harness is important for several reasons. These include:
- For debugging information such as print messages (although these can and should be sent through the debugger)
- Device commanding
- Monitoring internal communications between multiple devices
- Ease of use
A good general purpose UART tool that every developer should keep around the lab is the BOB-12731 FT232R, USB-to-UART evaluation board from SparkFun Electronics (Figure 7).
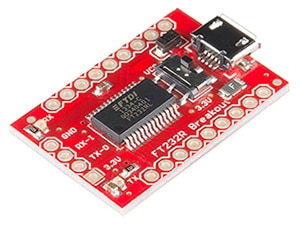
Figure 7: The BOB-12731 FT232R, USB-to-UART evaluation board from SparkFun Electronics is useful in any lab as it can be easily interfaced to any embedded system. (Image source: SparkFun Electronics)
These inexpensive boards can easily be interfaced to any embedded system and enumerate in a PC as a simple communication port. This eliminates any need for special drivers or software to communicate with the embedded system. A developer can simply open a COM port and start sending and receiving test messages.
Verifying every logic state
Fully testing an embedded system requires that a developer verify the internal workings of the microcontroller and the external logic that it is generating. This logic can be simple input and output states along with low-level communication such as I2C or SPI.
However, monitoring input/output states and low-level communication can be expensive if a developer is using ADC and digital-to-analog (DAC) boards. There are a few tricks that a developer can use to decrease the costs to monitor these signals and improve their testing capabilities.
The first trick is to use the development board from the microcontroller on the system to monitor the microcontroller pins. For example, if a developer is using an STMicroelectronics STM32F767 or STM32L4 microcontroller, they would start by purchasing a STM32F767 Nucleo board or a STM32L476RGT6 Nucleo board (Figure 8).
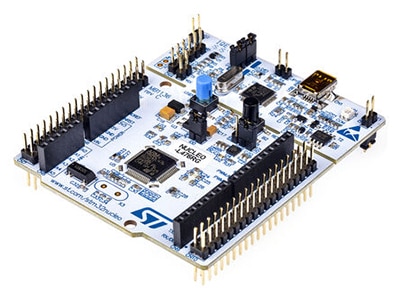
Figure 8: The STM32L476RGT6 Nucleo board can be used to monitor the pins on the STM32L4 microcontroller. (Image source: STMicroelectronics)
Next, they would use the header stand-offs on the board and directly jumper each I/O pin to the corresponding pin on their system. Since they have already developed the low-level drivers for the microcontroller, they can easily adapt those drivers to monitor their output and input states.
A developer could then add a little extra code, such as a USB driver, so that the development board can be directly plugged into the test host machine. The USB would then be used to receive input/output sample state data that can then be correlated to commands being sent and received from the system to determine if everything is working the way that it is supposed to.
In addition to using the development board, the test harness could also use a logic probe such as the Logic Pro 8, also from SparkFun (Figure 9).
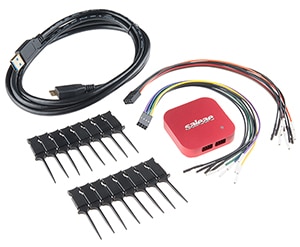
Figure 9: The Logic Pro 8 is a multifunction logic probe from SparkFun Electronics that allows each input to be programmed with respect to what it’s monitoring. (Image source: SparkFun Electronics)
These logic analyzers are multifunctional in that each input can be modified through software as to what is being monitored. For example, a developer can set the first two inputs to monitor a switch input, while the next two inputs are used to monitor I2C communication, and the remaining inputs monitor SPI. The data can easily be acquired and then synchronized with the rest of the test harness to provide a full picture into how the embedded system is operating.
Tips and tricks for building a test harness
It’s obvious that a test harness is required for many modern day embedded systems. Getting approval can sometimes be difficult, but the return on investment and the improvement in system robustness is many times the investment cost. When building up a test harness for the first time or even when upgrading a test harness, there are several tricks that developers can leverage to ensure they build the most effective test harness. These include:
- Using a development kit for the same processor as the main target to monitor the digital inputs and outputs of the microcontroller
- Invest in a trace capable debugger and leverage the free software packages available to gain the most insight into how the system is behaving
- When running a software trace, always use worst case tests to ensure you can capture the worst-case scenario
- If funds aren’t available to build a full test harness, start small and build the harness over time. Some testing is better than none.
- Take the time necessary to master the different tools and components that you use in your test harness
- Don’t be afraid to build your own interfaces and leverage existing software to peek into the system behavior
- Don’t assume anything! If you are not monitoring an output or triggering an input, then that is most likely where a bug is residing.
Conclusion
Developing a test harness for an embedded system is an inexpensive way to improve the reliability of an embedded system. Careful selection of test harness components can allow a developer to easily monitor the external behaviors of their software. The most critical and often overlooked aspect of testing is examining the trace data that is now easily accessible from the microcontroller. Using this trace data, developers can perform a Deep Insight Analysis while executing their test cases to ensure that their software is behaving and performing exactly as expected, down to the individual instructions.

Disclaimer: The opinions, beliefs, and viewpoints expressed by the various authors and/or forum participants on this website do not necessarily reflect the opinions, beliefs, and viewpoints of DigiKey or official policies of DigiKey.


